Drawing Tube Load Lines
& Using Them to Design Tube Circuits
By Rob Robinette
Have comments or corrections? Email rob at:
![]()
Table of Contents
Determine Internal Plate Resistance
Draw the AC Signal Plate Load Line
Draw the Max Plate Dissipation Curve
Marshall Cold Clipper Load Line Chart
Cathodyne Phase Inverter Load Line Chart
Lead Channel Mod Load Line Chart
Warm Biased 12AX7 Load Line Chart
12AX7 Max Gain Stage Load Line Chart
AB763 Tremolo Oscillator Load Line Chart
6V6GT Pentode Power Tube Load Line Chart
EF80 Small Pentode Power Amp Design Using The Plate Characteristics Chart
Intro
To really understand how tubes work you need to learn to use the tool used by circuit designers to build amp circuits--load line charts. You can't help but learn about tube circuit operation by playing around with these charts. You'll get to know how all the basic parts interact like, "What happens when I increase the value of the plate load resistor? How about decreasing plate voltage? What supply voltage will give me the cleanest signal with the most headroom?" These charts will answer those and many other questions about tube operation.
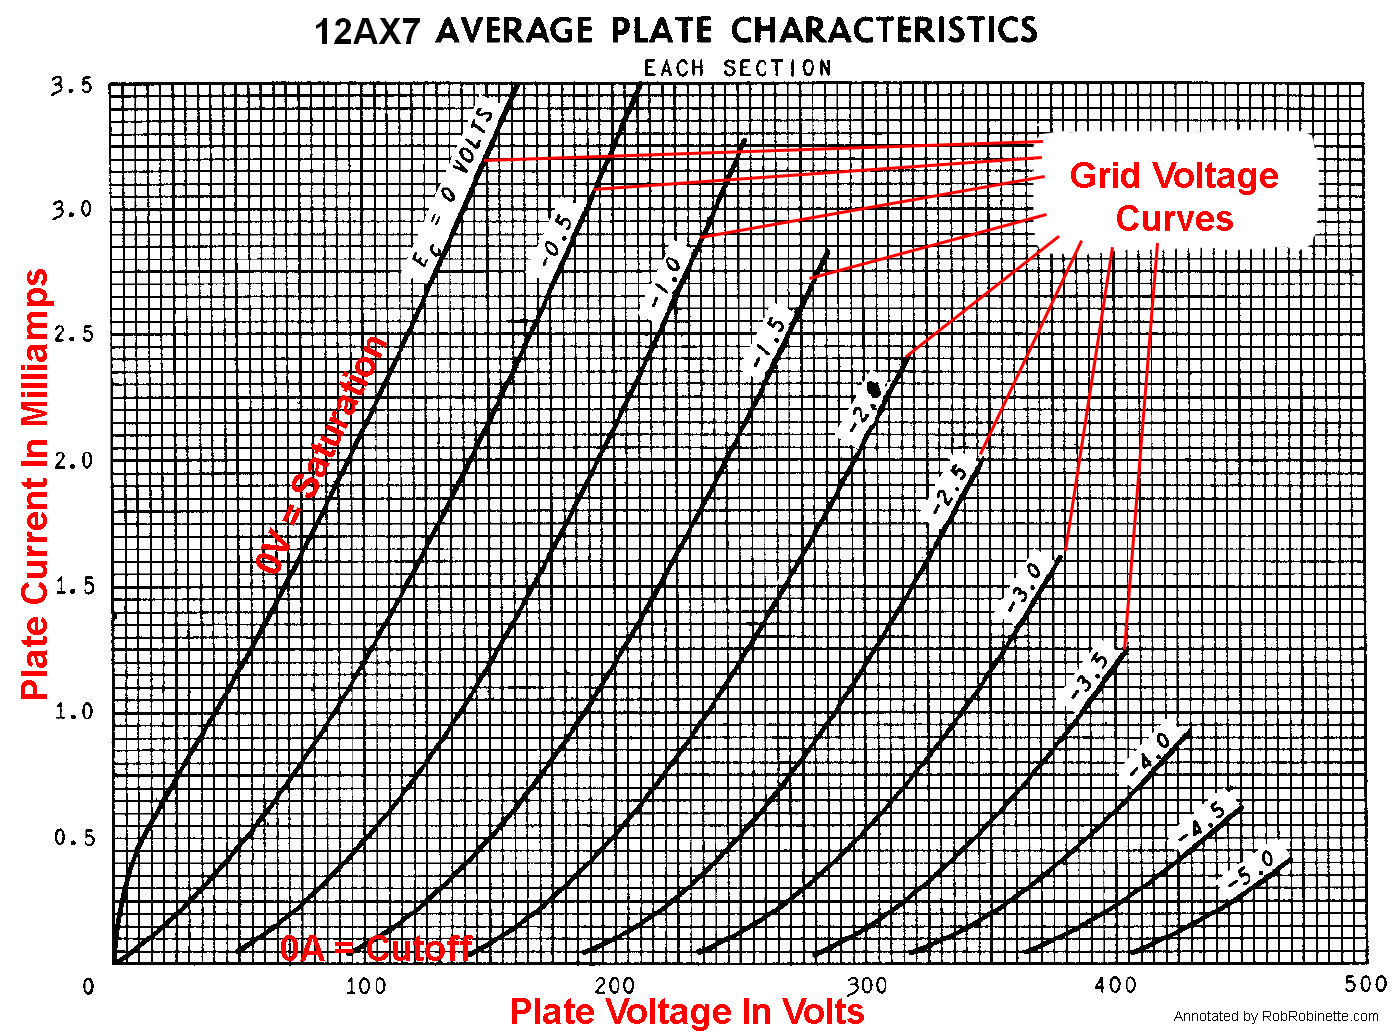
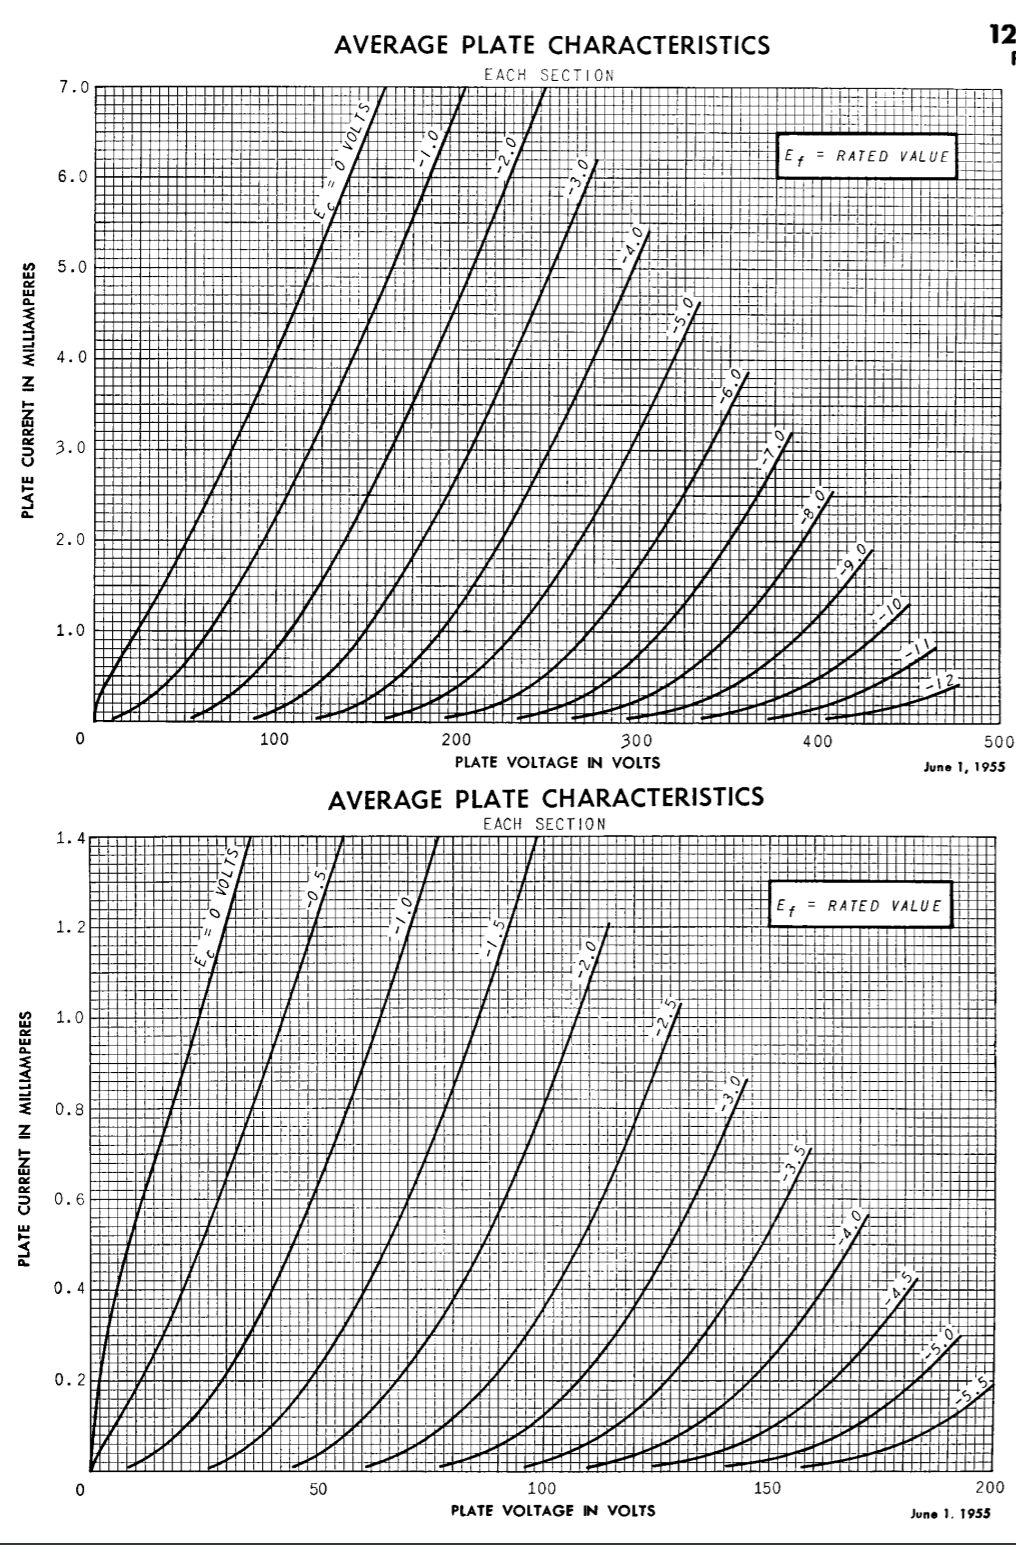
Looks complicated but it's not. Plate voltage on the bottom, plate current along the left and grid voltage curves inside. Saturation (valve wide open) and grid clipping occurs near the 0V grid voltage curve. Cutoff occurs at the bottom of the chart at 0 amps. Notice the curved grid voltage lines? They are curved so they are nonlinear and always induce nonlinear distortion which also causes harmonic and intermodulation distortion. This is why tube amps tend to sound "warm". The distortion fattens up the tone of anything being amplified by a tube circuit.
Notice how the grid voltage lines are curved? Since the lines aren't straight we say they are "nonlinear" and those curves cause nonlinear distortion even when the amp is played clean--but that's not a bad thing. Nonlinear distortion generates harmonic and intermodulation distortion and is what makes a guitar amp sound warm and thick compared to when you plug a guitar into a Hi-Fi audio amplifier (if you haven't tried it it sounds terrible--thin and anemic). If a tube operates in the lower, "curvier" part of the chart we'll get more nonlinear, harmonic and intermodulation distortion.
5E3 Deluxe Second Gain Stage
Let's draw the load lines for the 5E3 Deluxe second gain stage (V2A). It's a very common gain stage that's used in many amps. The V2A gain stage uses a 12AX7 triode with a 250V plate supply voltage, 100k plate load resistor and 1.5k cathode resistor. The following stage's impedance load is made up of a 1M grid leak resistor + a 56k tail load resistor.
We'll be drawing the load lines for the second preamp stage V2A (center left).
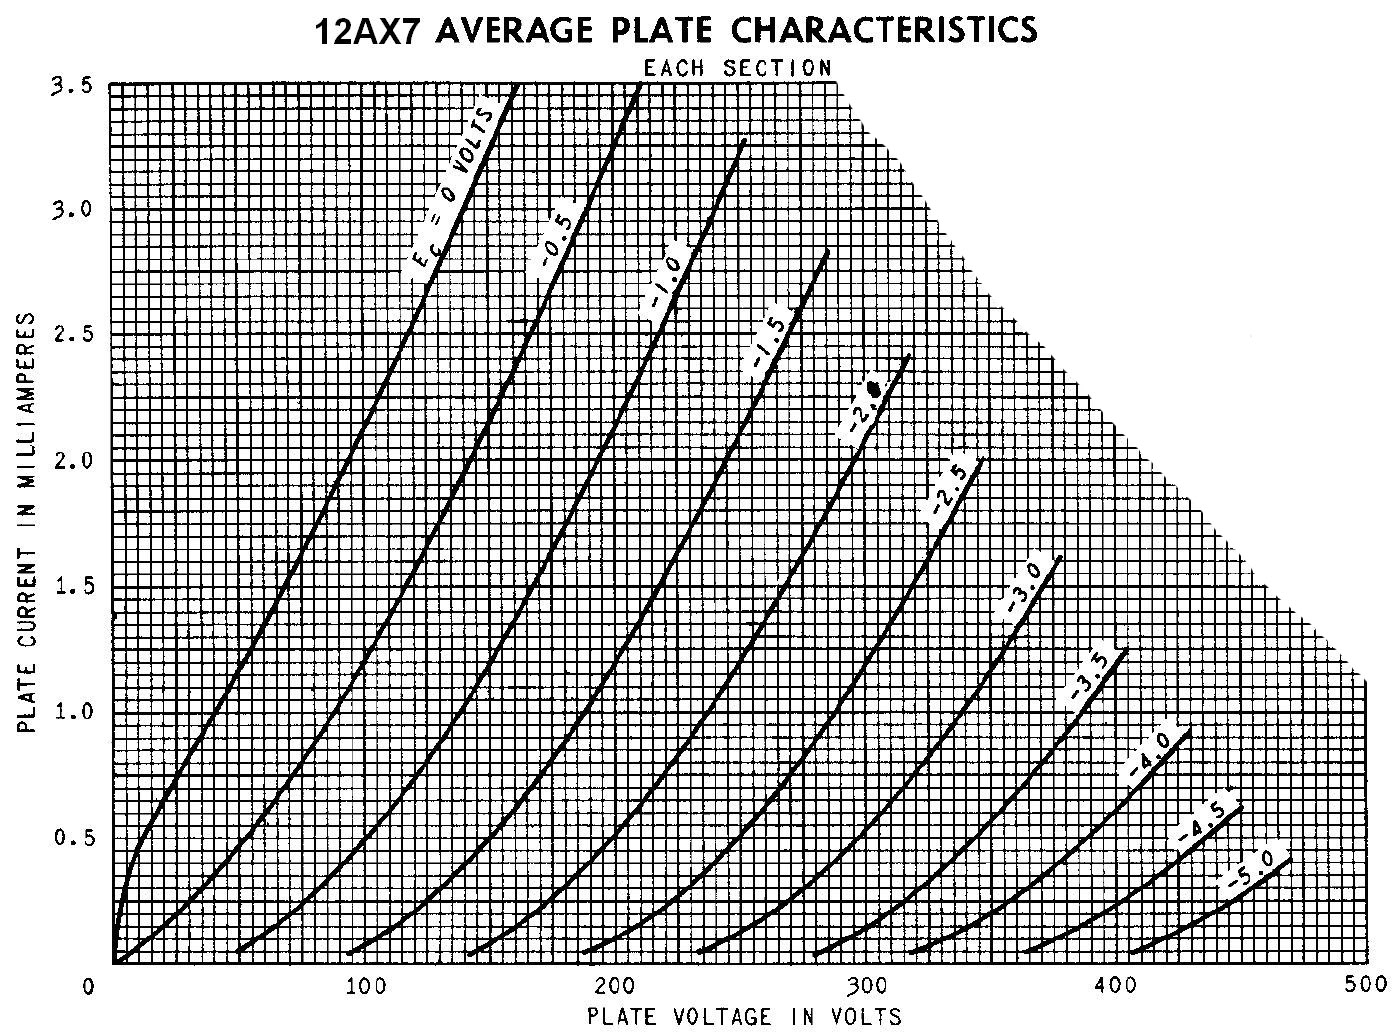
To get your blank plate characteristics chart just Google "12AX7 datasheet" and find the "Average Plate Characteristics" chart then copy and paste the chart into your drawing program. I really like the free irfanview drawing program.
Here's a blank 12AX7 Plate Characteristics chart you can use with your drawing program to plot lines.
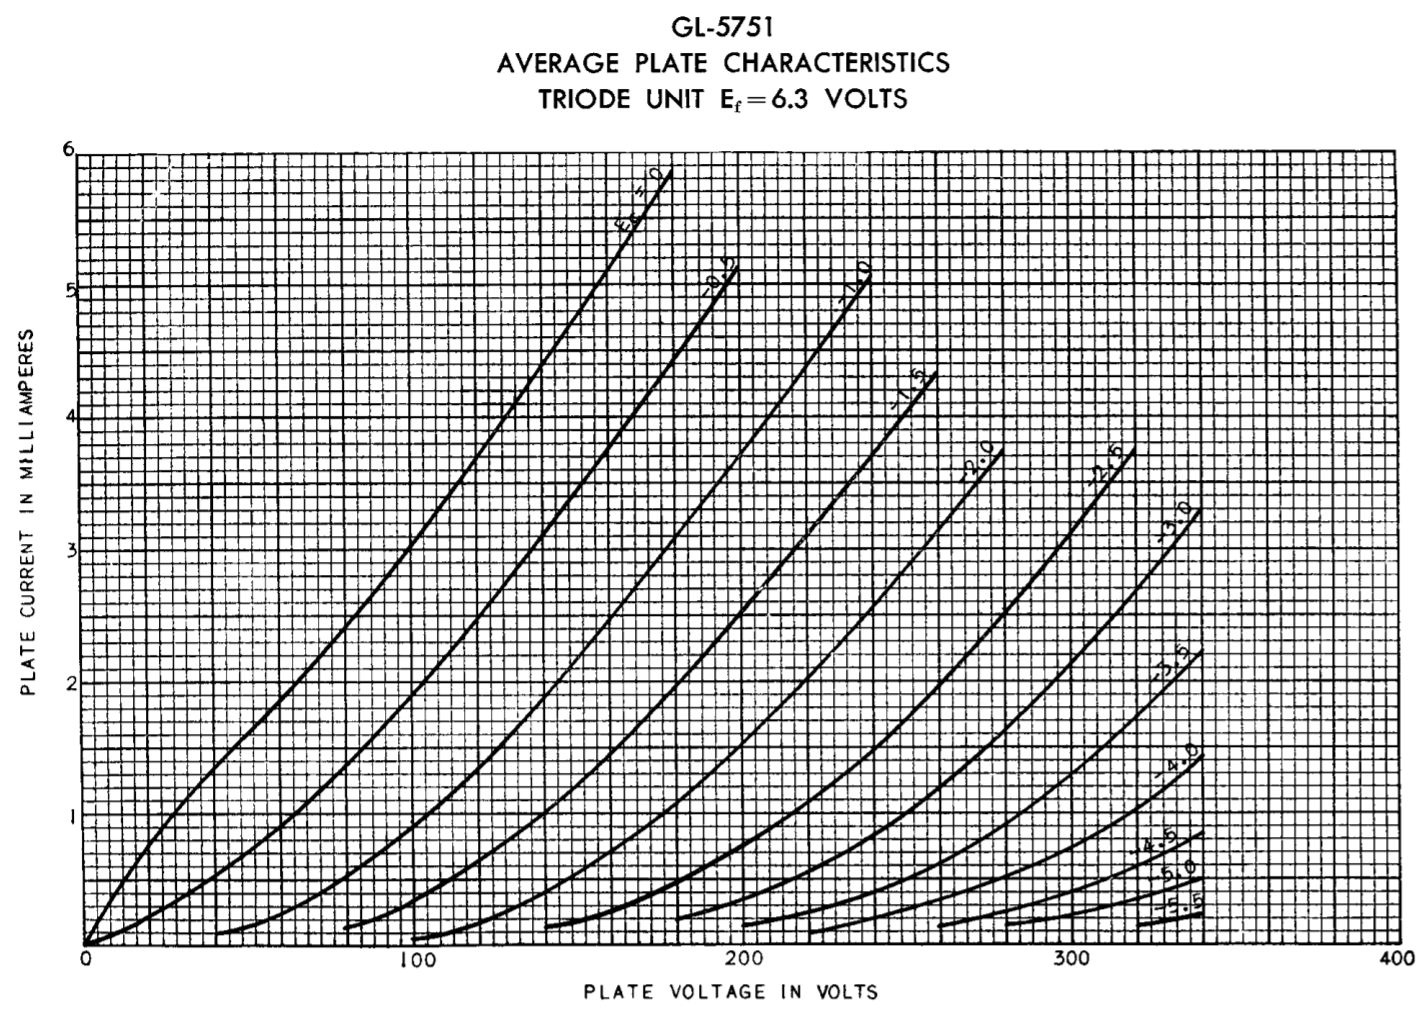
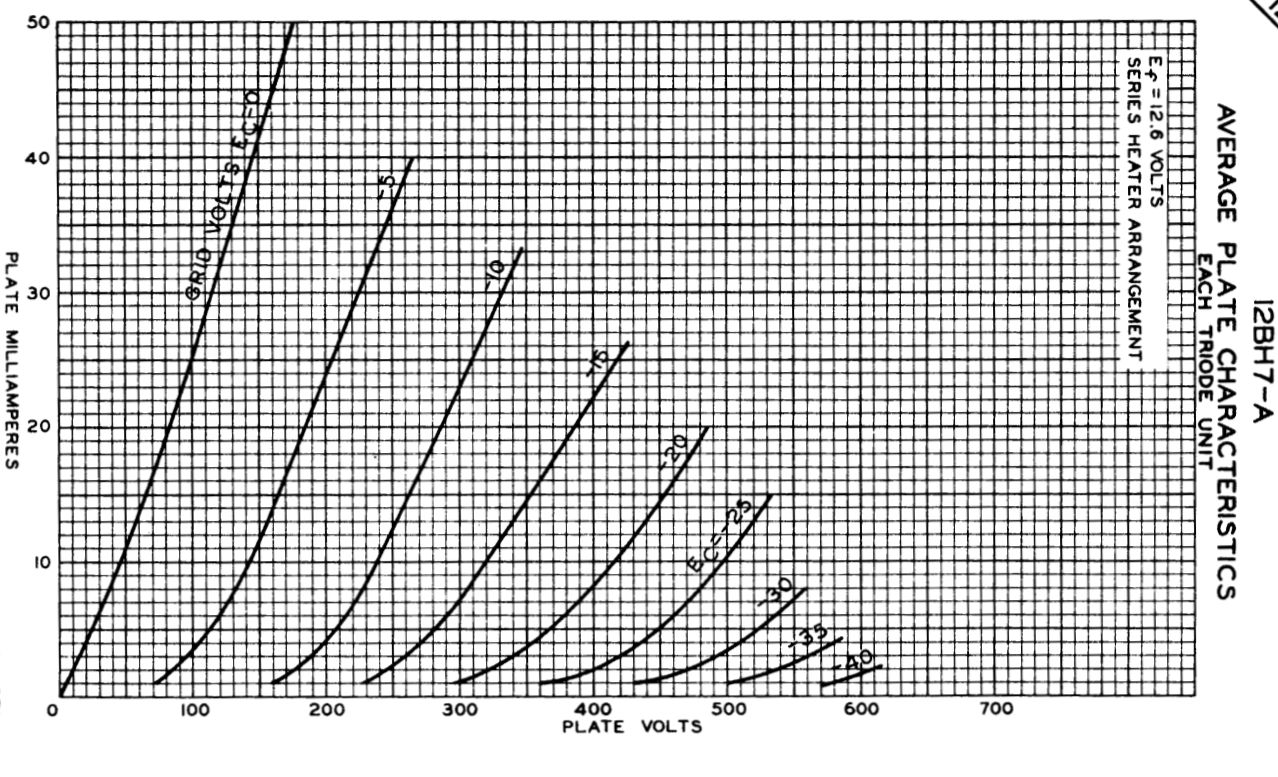
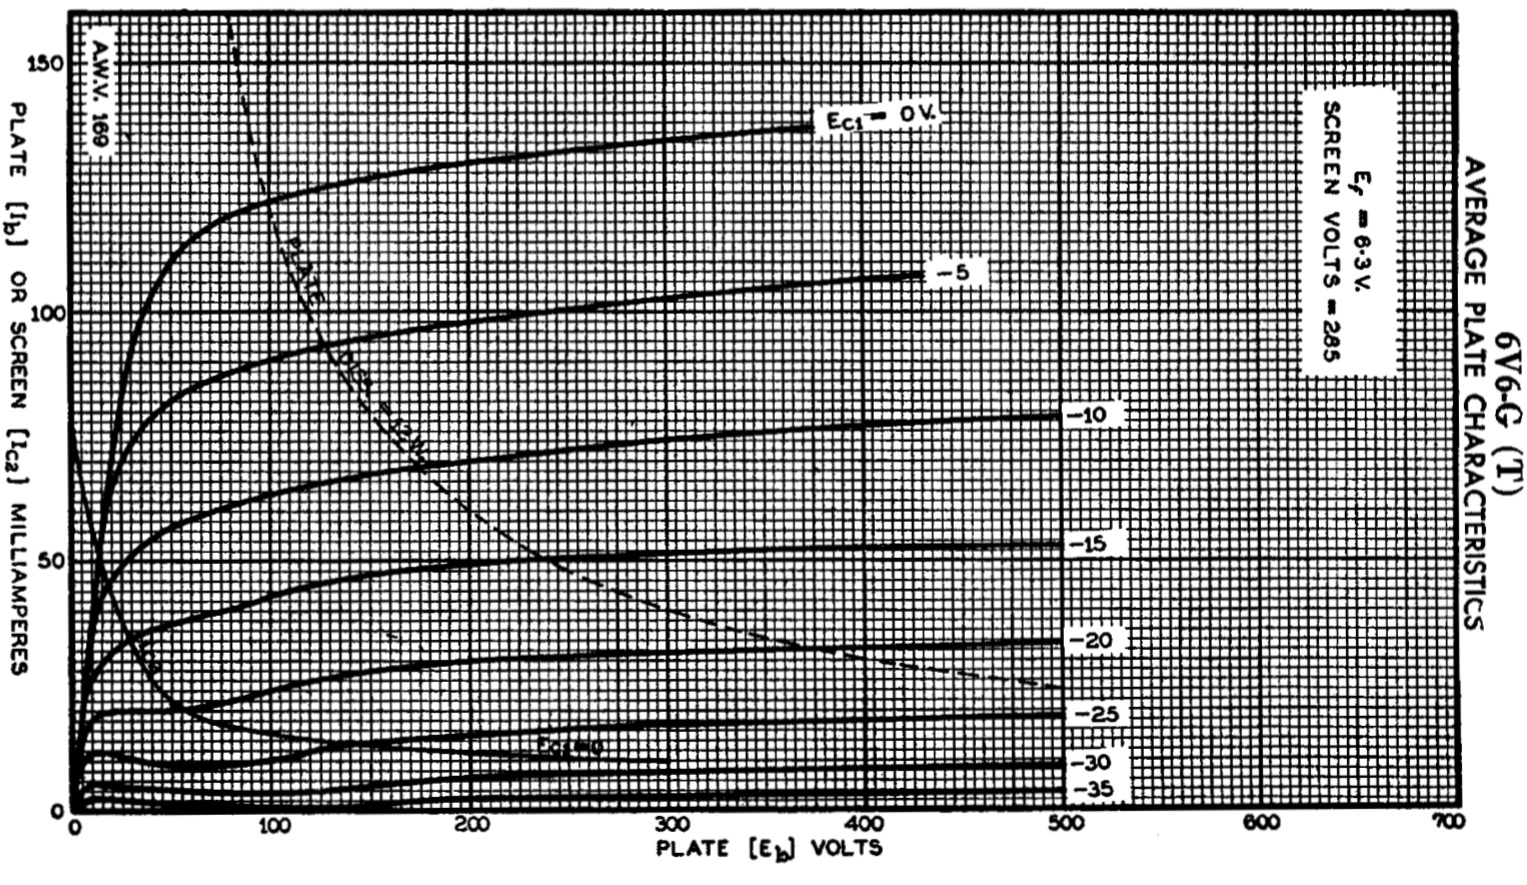
12AY7 chart 5751 chart 12AU7 chart 12AT7 chart 12BH7A chart 6V6GT chart
To draw other tube load lines just Google their datasheet and follow the directions below. Of course you can always use paper, pencil and a ruler too.
The Completed Load Line Chart
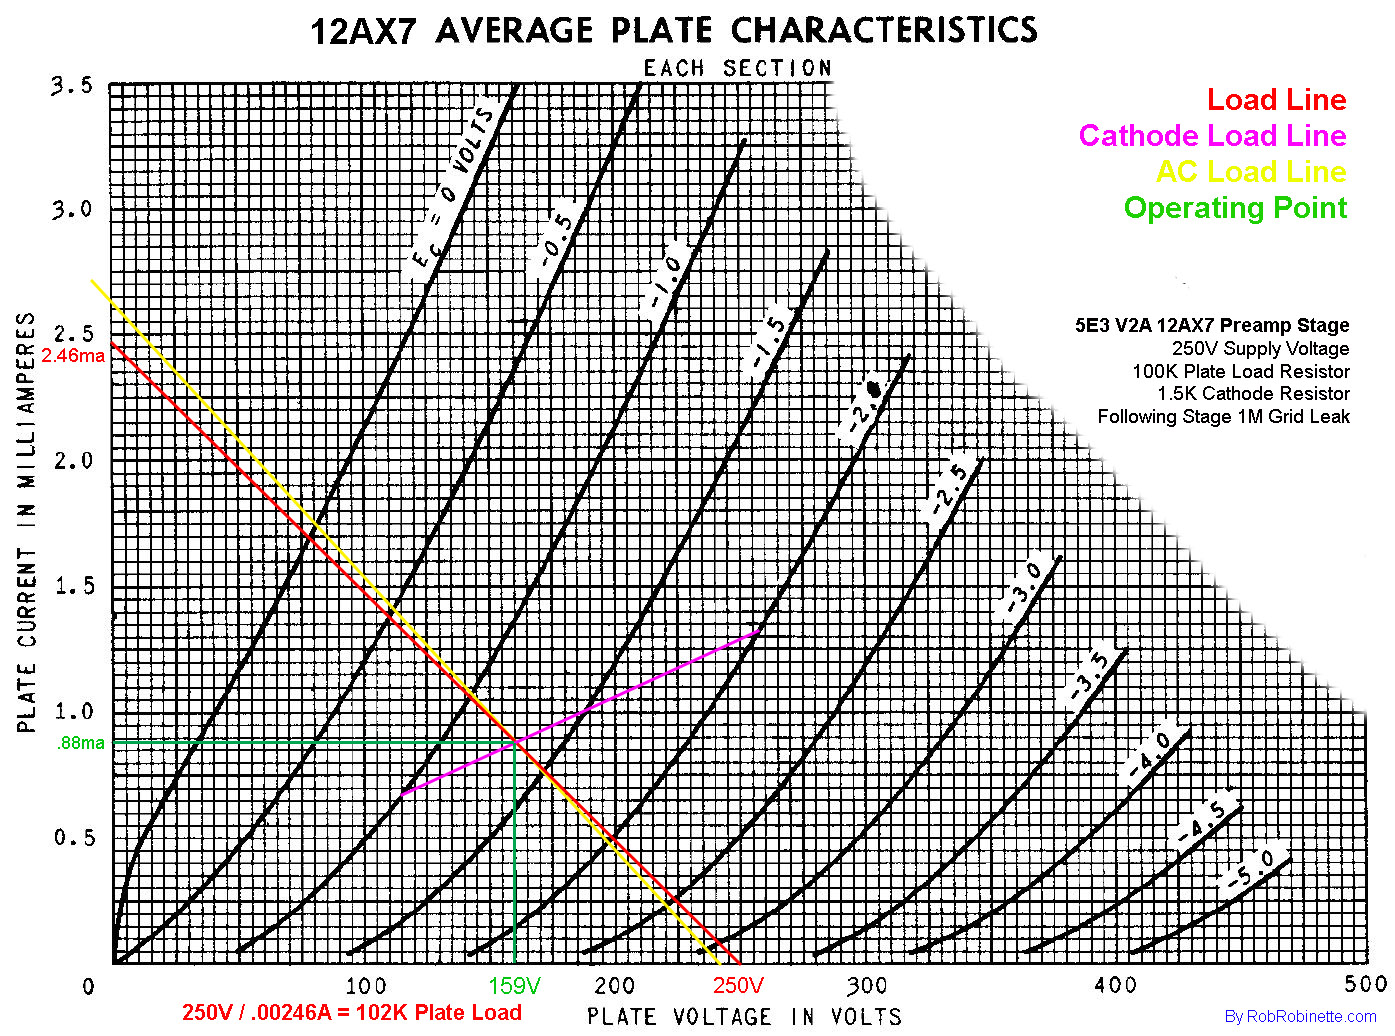
That's a lot of lines! This is what we'll end up with when we finish drawing. Note the color coded legend at upper right. Load line in red, cathode load line in magenta, AC load line in yellow and operating point in green.
Draw the Load Line
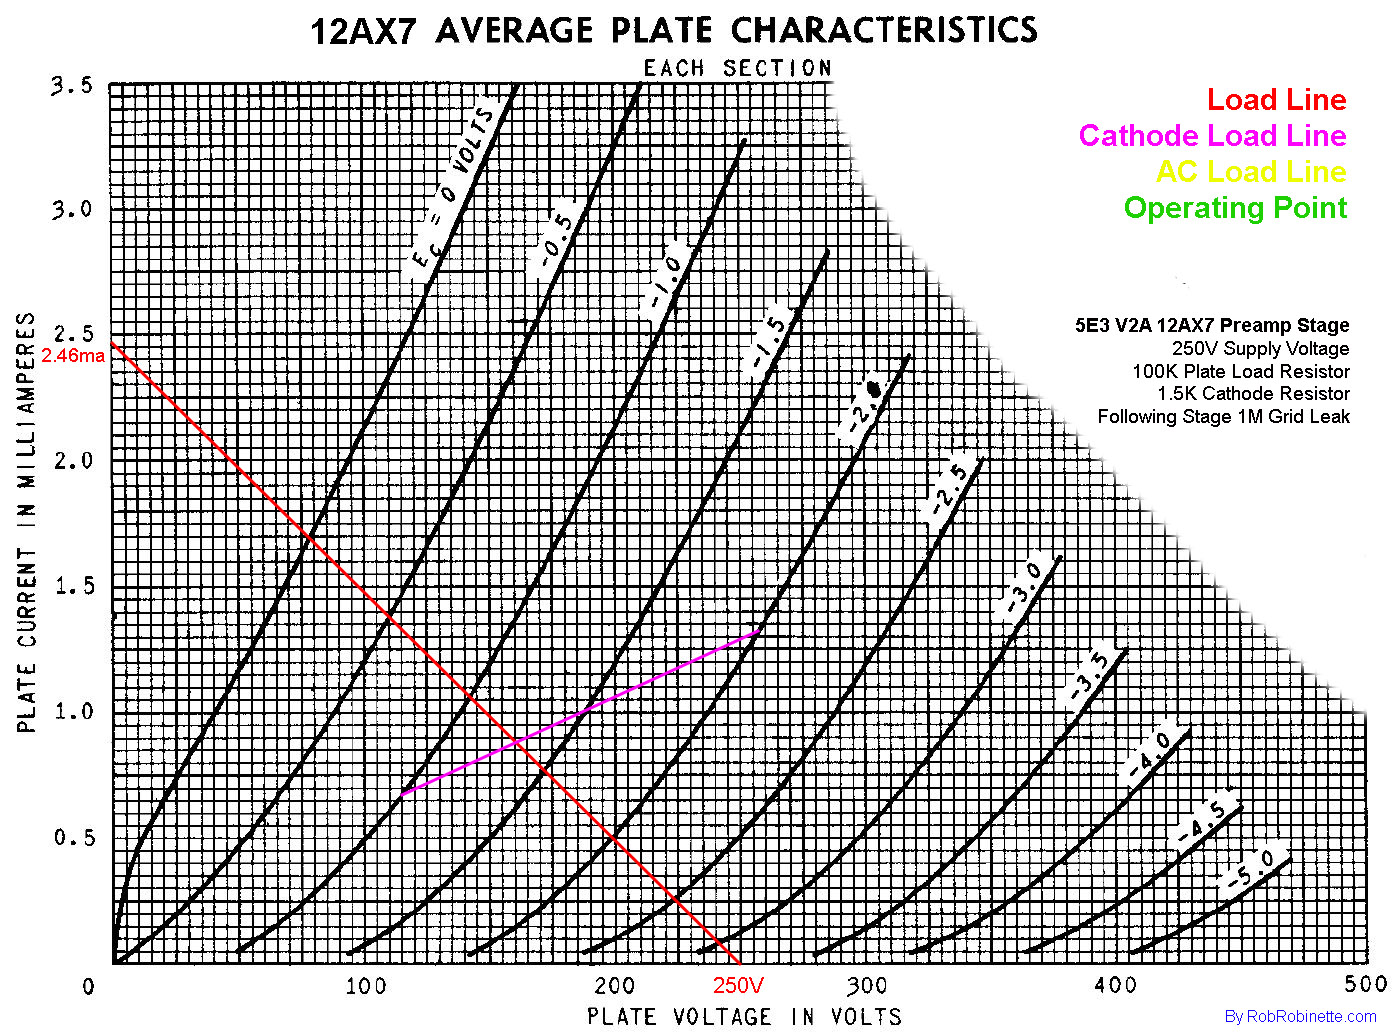
We start our exercise with the DC plate load line. When you see just "load line" that's what is meant, the "DC plate load line". The bottom point of the line is the plate supply voltage (B+3) of 250 volts. We use the supply voltage because when current flow is cutoff by the tube there well be no voltage drop across the plate load resistor so plate voltage will equal supply voltage. The bottom of the chart is the 0 current (cutoff) line and at cutoff plate voltage = supply voltage.
We calculate the left end of our line by using Ohm's law and dividing the supply voltage by the plate and cathode resistors (100k plate load resistor + 1.5k cathode resistor)
250V / 101,500Ω = .00246A or 2.46ma
We add the resistance of the cathode and plate resistors because all the current that flows through the tube has to flow through those two resistors.
If we we're drawing a phase inverter load line we would include the "tail resistor" and presence pot resistance in the equation.
Here's a simple Excel spreadsheet that will calculate the load line, cathode load line and AC load line points: Calculate Tube Load Lines.xls
We then draw our load line from 250 volts on the bottom of the chart to 2.46ma on the left side of the chart.
Load Line
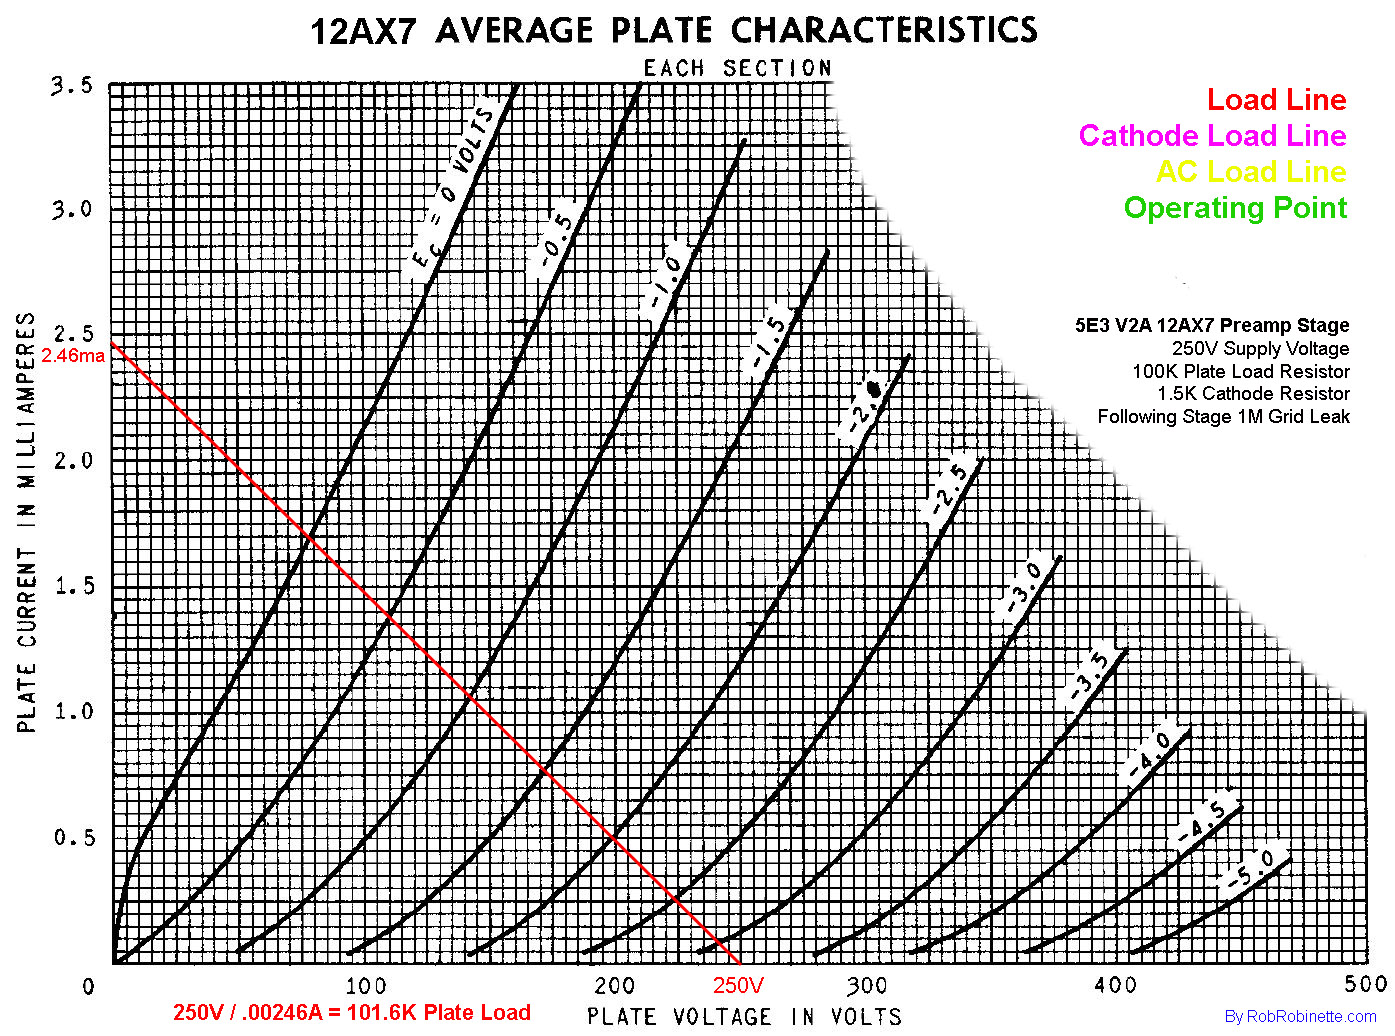
The plate load line is drawn from our power supply voltage of 250V to our calculated plate current of 2.46 milliamps.
Increasing the value of the plate load resistor will reduce plate current, make the load line more horizontal and increase gain. You'll see why a more horizontal line increases gain below in the Voltage Gain section. Increasing the plate load will also increase the impedance of the output signal (more voltage swing but less current to back it up = a "thinner" signal).
Reducing the value of the plate load will increase plate current, make the load line more vertical, reduce gain and lower the impedance of the output signal ("thicker" signal).
Increasing the supply voltage will shift the line to the right but it will stay pretty much parallel to the original load line. If we change the supply voltage to 350 volts the load line would cross more grid voltage curves. That means we'd have more grid voltage swing available with more headroom.
Reducing supply voltage will shift the load line left and offer less headroom.
The slope of the load line is the primary indicator of gain. The steeper (more vertical) the load line the lower the gain.
If we were designing a gain stage from scratch we could draw a line from our desired supply voltage to our desired plate current then calculate the external plate resistance (plate load resistor + cathode resistor) by dividing our chosen plate supply voltage by the plate current. Using the numbers from the chart above we divide 250V supply by .00246A = 101.6k ohm plate load which is very close to our actual plate load made up of the 100k plate load resistor and 1.5k cathode resistor.
Draw the Cathode Load Line
Cathode Load Line
I plotted two points, one on the -1V grid voltage line and one on the -2V line, then connected them to draw the cathode load line.
Our 5E3 amp's second gain stage uses a 1500Ω cathode resistor. We'll plot two points, one on the -1V grid line and another on the -2V grid line.
-1V grid line = 1V / 1500Ω = .67ma and plot this point on the -1V grid line.
-2V grid line = 2V / 1500Ω = 1.33ma and plot this point on the -2V grid line.
We then draw the cathode load line between the two plotted points.
The size of the cathode resistor sets the operating point (intersection of the plate and cathode load lines detailed in the next section) along the red plate load line which affects headroom. For the most clean headroom we want the operating point halfway between the 0 volt grid line (saturation and grid clipping) and the bottom of the chart (cutoff). If we want less clean headroom we can shift the operating point away from the mid point. The Cold Clipper further down the page does just that by placing the operating point very low in the chart.
A smaller cathode resistor will warm the bias and increase gain (see the Voltage Gain section for an explanation). A larger cathode resistor will cool the bias and decrease gain.
When plotting these points you may have to use other grid voltage lines. For example when I plotted the Marshall cold clipper stage further down the page I had to plot using the -2 and -3V grid voltage lines to get the cathode load line to cross the plate load line. For an 820 ohm cathode resistor I had to use the -.5 and -1.5V grid lines.
For fixed bias amps we can't calculate a cathode line because we can't divide by 0 ohms of cathode resistance. We simply pick the point along the plate load line that crosses the grid voltage. For example, if our fixed bias grid voltage is -0.5 volts we would use the intersection of the red plate load line and the -.5v grid curve.
Draw the Operating Point
The operating point is the intersection of the load line and cathode load line. The operating point is also known as the bias point, idle point, no signal point, quiescent point and Q point.
Operating Point
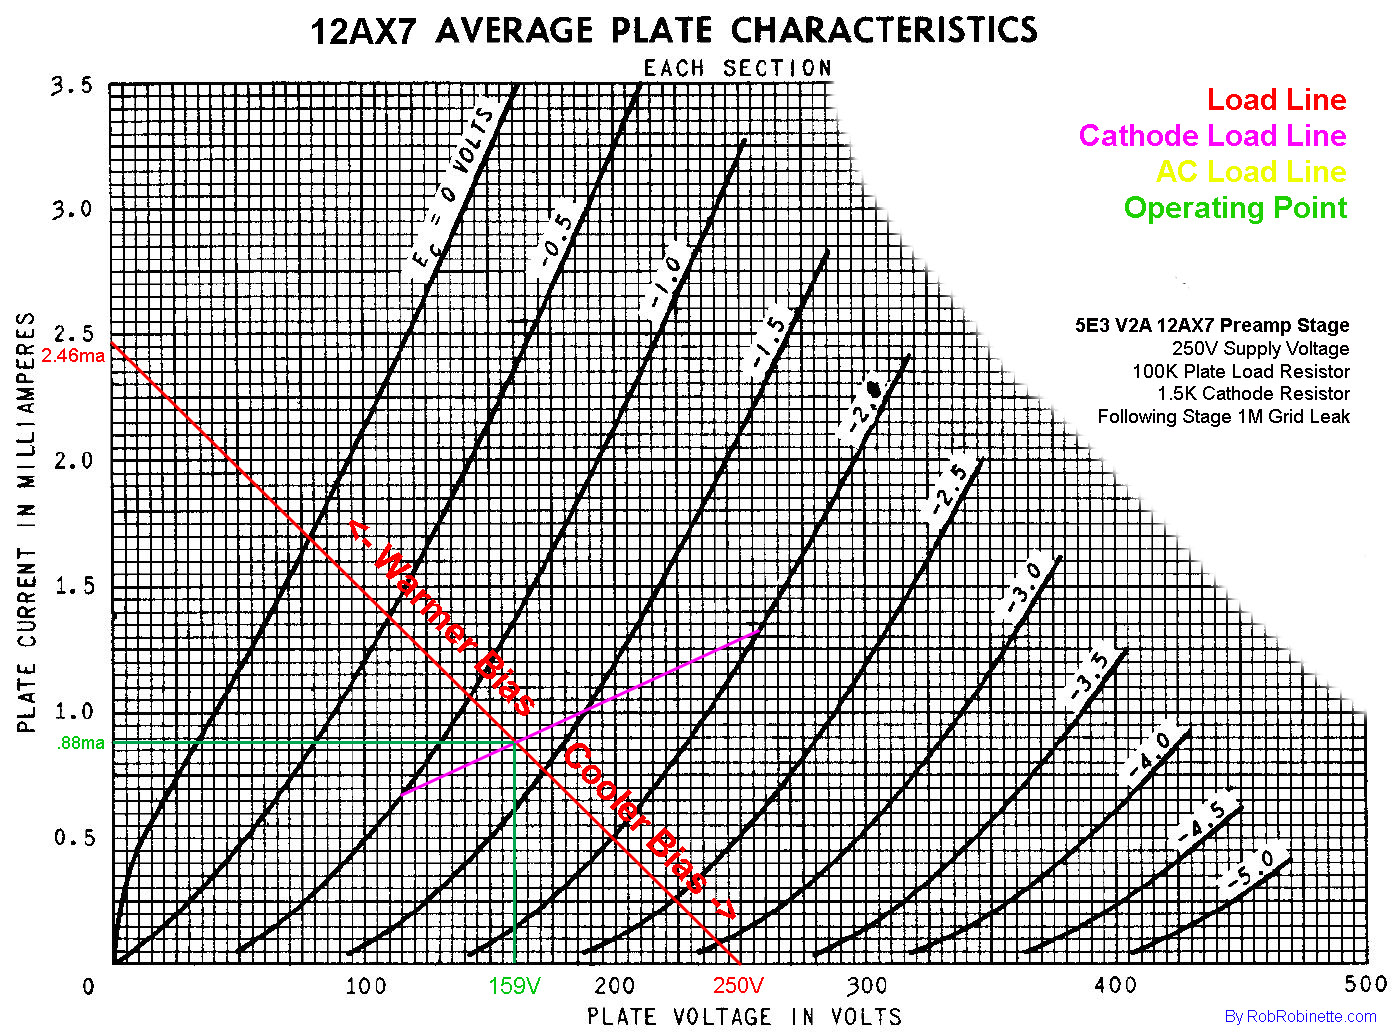
The operating point is the intersection of the plate load line and cathode load line. Notice how the bias point is just about in the middle of the load line from the 0 grid volt line to the bottom of the chart. That means this triode is close to being "center biased" which minimizes distortion and allows the maximum plate voltage swing before symmetric clipping begins. This chart says our triode should idle at the green lines, 159 plate volts, .88 milliamps of plate current and a bias voltage of -1.3V. Beam resistance at idle is: 159V / .00088A = 181k.
A lower value cathode resistor will "warm the bias" by shifting the operating point to the left and up along the red load line. A higher value cathode resistor will "cool the bias" and shift the operating point down and to the right. Moving the operating point away from the mid point between the 0v grid line and bottom of the chart will reduce clean headroom which is often desired in guitar amplifiers.
If we boosted the supply voltage to 300 volts but left the plate load at 100k and cathode resistor at 1.5k our load line would run between 300V and 2.96ma (300v / 101.5k = 2.96ma). The chart's grid voltage curves are straighter along this 300V load line so we'd get a little less distortion. We'd also get a little more headroom from the extra length along the load line between the 0V grid line (saturation) and the bottom of the chart (cutoff) for more available grid voltage swing and headroom.
Internal Plate Resistance
To calculate internal plate or anode resistance, called ra or rp or rip we'll move +/-25 plate volts from the operating point paralleling the nearest grid voltage curve and read the plate current at +25 and -25 plate volts.
We then divide the plate voltage change of 50 volts by the plate current change of .85ma to get the internal plate resistance:
50V / .00085A = 58.8kΩ rp
Internal Plate Resistance
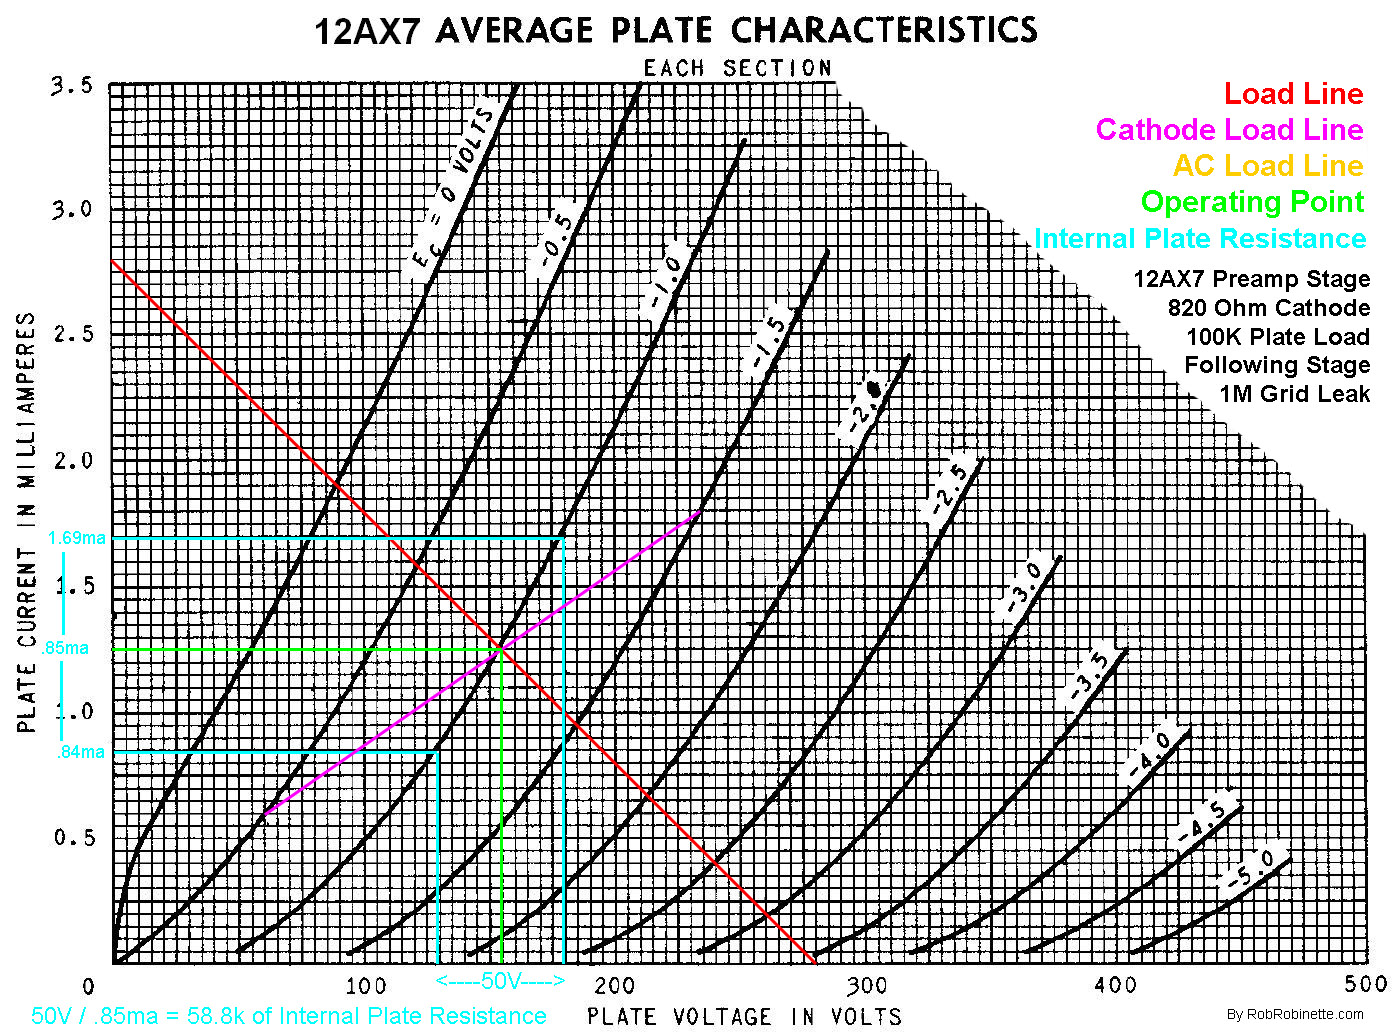
The cyan lines translate +/- 25 plate volts from the operating point to plate current. 1.69ma - .84ma = .85ma of plate current change for a 50 plate volt change. Note this chart is from the "Warm Biased 12AX7" section below.
Draw the AC Signal Load Line
Before we can determine our triode's AC signal voltage gain we must first plot the AC load line. Why is the AC plate load line different than the DC plate load line? Because the coupling cap connected to the plate stops the flow of DC. The DC load line isn't affected by anything beyond the coupling cap but the AC guitar signal passes through the coupling cap and gets loaded down by the impedance in the following circuit so we must consider the impedance beyond the coupling cap to draw our AC load line.
AC Load Line
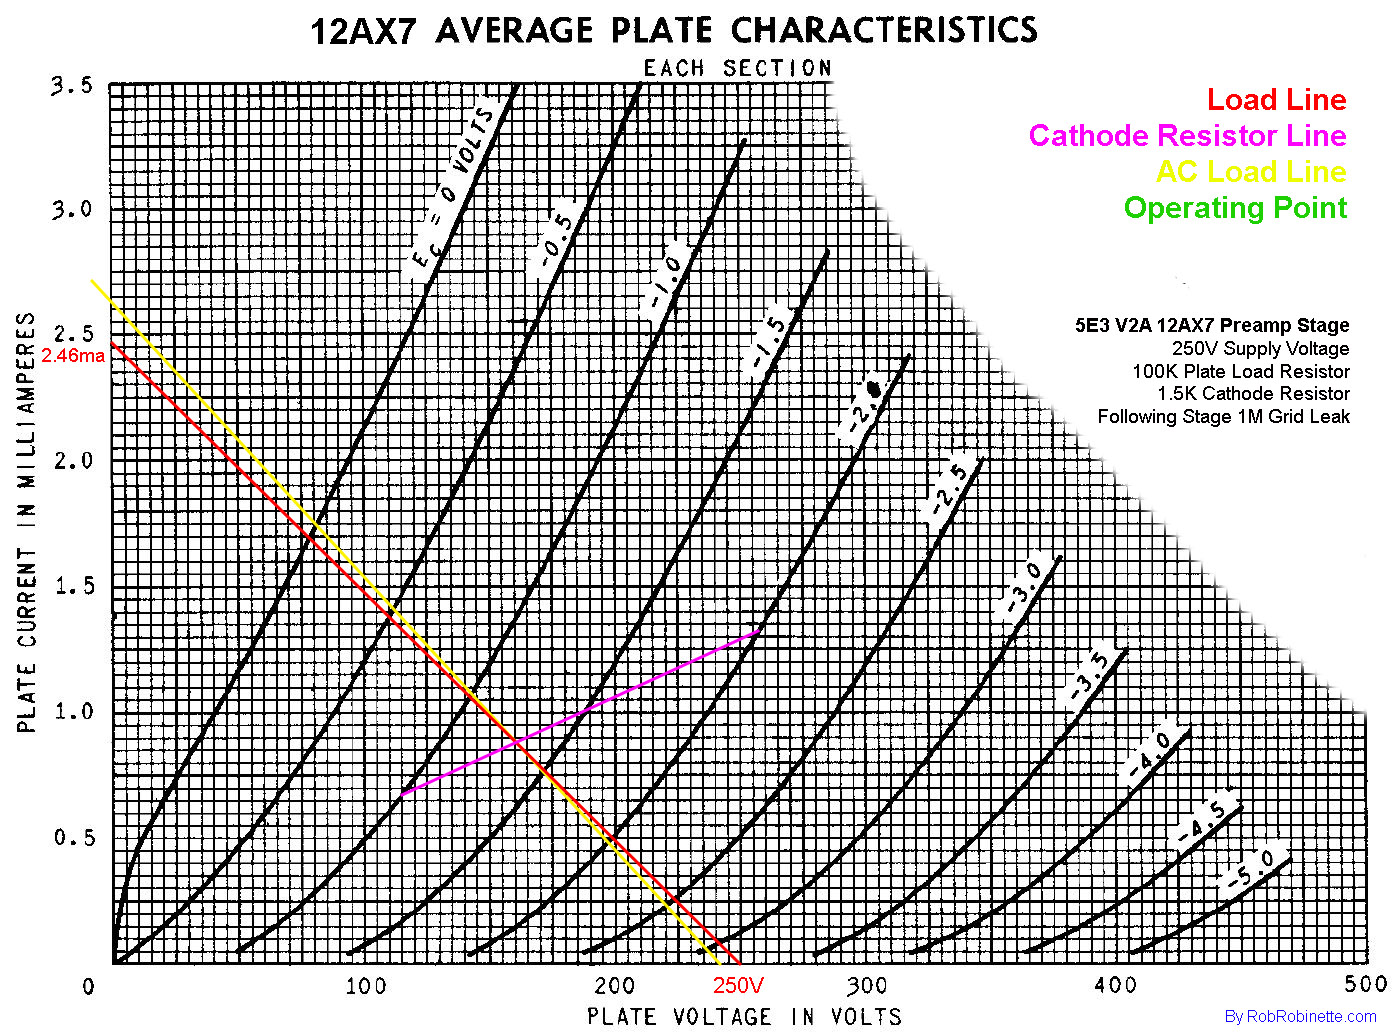
The AC (signal) load line in yellow is slightly steeper (meaning less voltage gain) than the DC load line.
The AC load on our triode equals: plate load resistor + in parallel with the impedance of the following circuit. In the 5E3 the following circuit is the phase inverter with a 1M grid leak resistor and a 56k phase inverter tail resistor. Note that we don't include the V2A cathode resistor because it has a bypass cap around it which allows AC to go around the resistor.
plate load 100k || 1M grid leak + 56k phase inverter tail resistor. The || means "in parallel with".
The equation for parallel resistance is: 1 / (1/100k + 1/1056k) = 91.3k impedance (hint: use your calculator's 1/x inverse key)
We then calculate the AC current: 250V / 91,300Ω = 2.73ma
We now draw the AC load line from 250V on the bottom of the chart to 2.73ma on the left.
Now this is the tricky part, we must slide the AC load line to the left until it intersects with our operating point (shifted line shown above in yellow). This is easy to do in some programs like Adobe Photoshop but others like irfanview don't allow it. Keep the AC load line's slope the same, just slide it to the left. You can also draw a second AC load line paralleling the first, but run it through the operating point, then erase the first line if possible.
The heavier the load of the following circuit, the steeper the AC load line becomes which reduces voltage gain.
Note: Since the 5E3's V2A gain stage's following circuit is a "bootstrapped" cathodyne phase inverter its input impedance is in reality much higher (around 10M) than our calculated 1056k so the true AC load line pretty much overlies the DC load line in this example. This occurs because the input signal on the phase inverter grid is also present at the top of the tail resistor. This in-phase tail resistor signal reduces signal loss through the grid leak resistor which greatly reduces the load shown to our V2A gain stage.
Draw the Voltage Gain
Voltage Gain
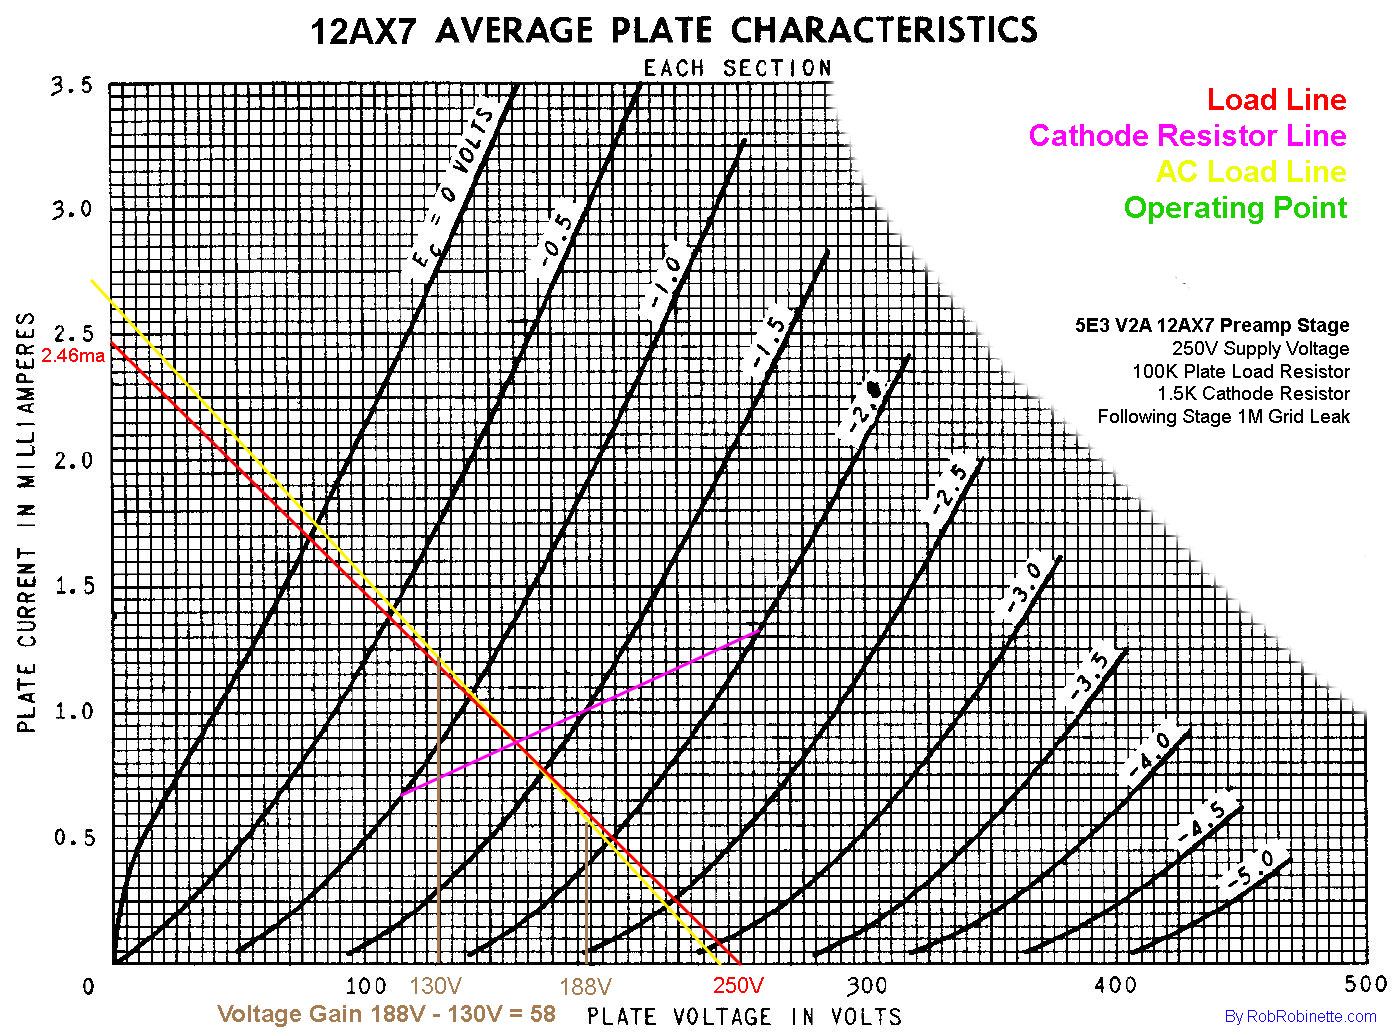
The operating point is at -1.3 grid volts. Go .5 grid volt left and right of the operating point along the yellow AC load line (gold lines) then drop down to get the plate voltages: -.8 grid volts = 130 plate volts. -1.8 grid volts = 188 plate volts. 188 volts - 130 volts = a voltage swing of 58, so for a 1 AC volt peak-to-peak change on the grid we'll get 58 volts of plate voltage change. In other words, 1 volt in is amplified into 58 volts out.
We can see from this chart that a heavy load from the following circuit, such as a TMB tone control, will make the AC load line more vertical and offer less voltage gain.
A higher value cathode resistor will shift the operating point down and to the right along the plate load line and since the grid voltage curves are spaced tighter down low we will get less voltage gain. A 2.7k cathode resistor will lower the voltage gain from 58 to 52. This is why a cold clipper stage with an unbypassed 10k cathode resistor has such low gain.
Max Voltage Swing
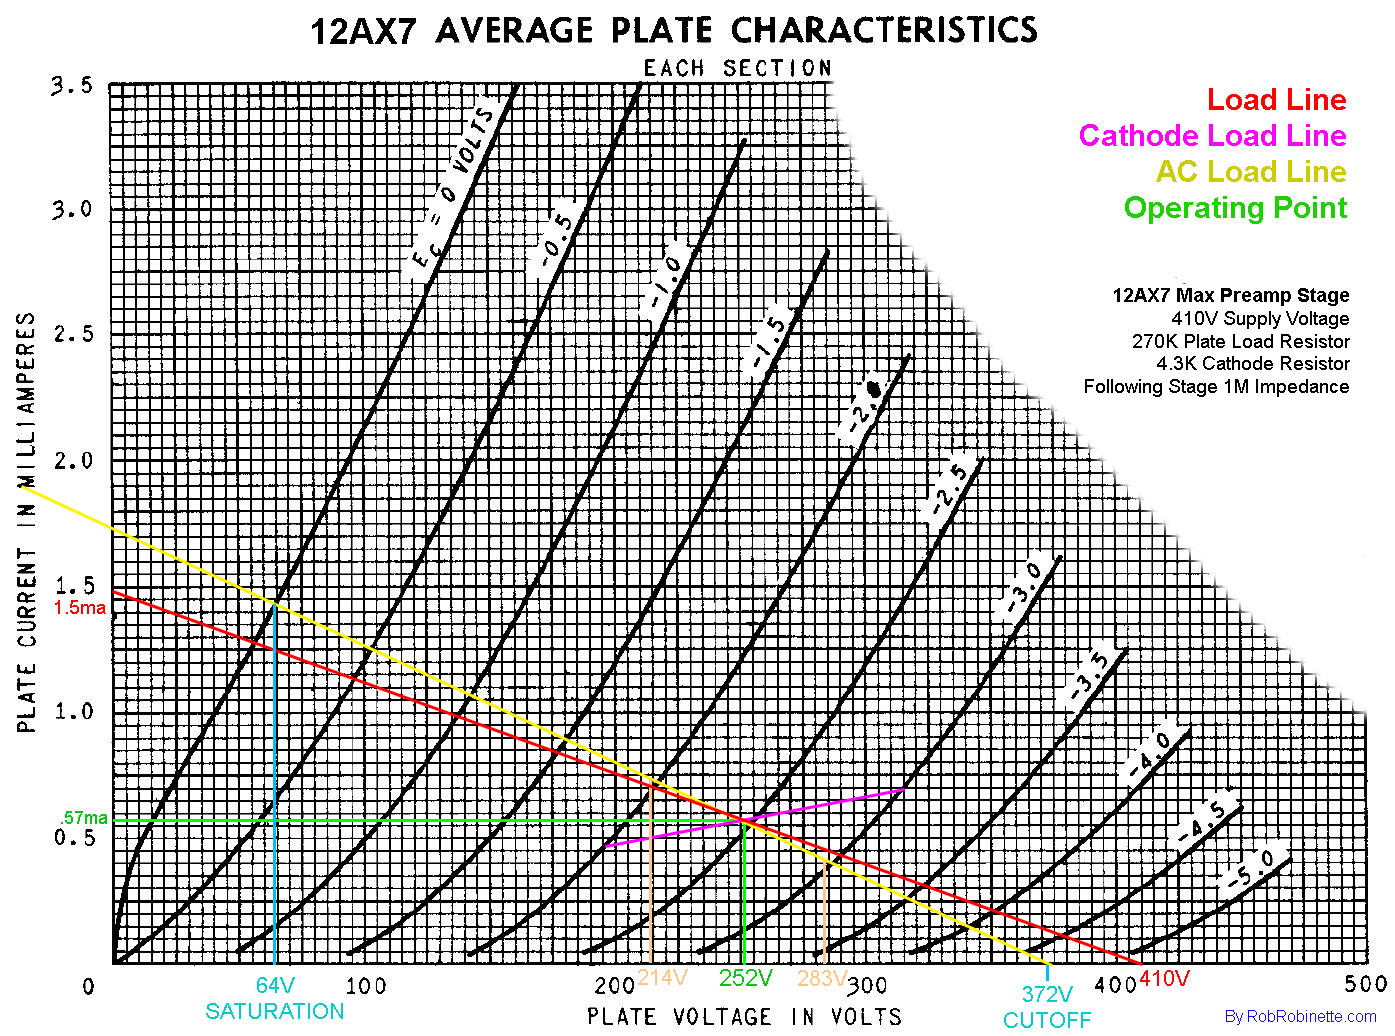
Max voltage swing (in light blue) runs along the yellow AC Load Line from the 0 Volt grid line on the left (representing saturation or grid clipping) to 0 milliamps of current at the bottom of the chart (representing cutoff). 372V - 64V = 308 volts of maximum voltage swing from this max effort preamp stage with 410V plate voltage, 270k plate load resistor and 4.3k cathode resistor. We have 188 plate volts from the 252v idle point to saturation at 64v and 120v from idle to cutoff at 372v. A perfectly centered bias would have the operating point at -2.3 grid volts allowing a -2.3v swing to the 0v grid line and a +2.3v swing to cutoff. A 3.9k cathode resistor would get us close to that and also slightly increase gain.
Max Plate Dissipation Curve
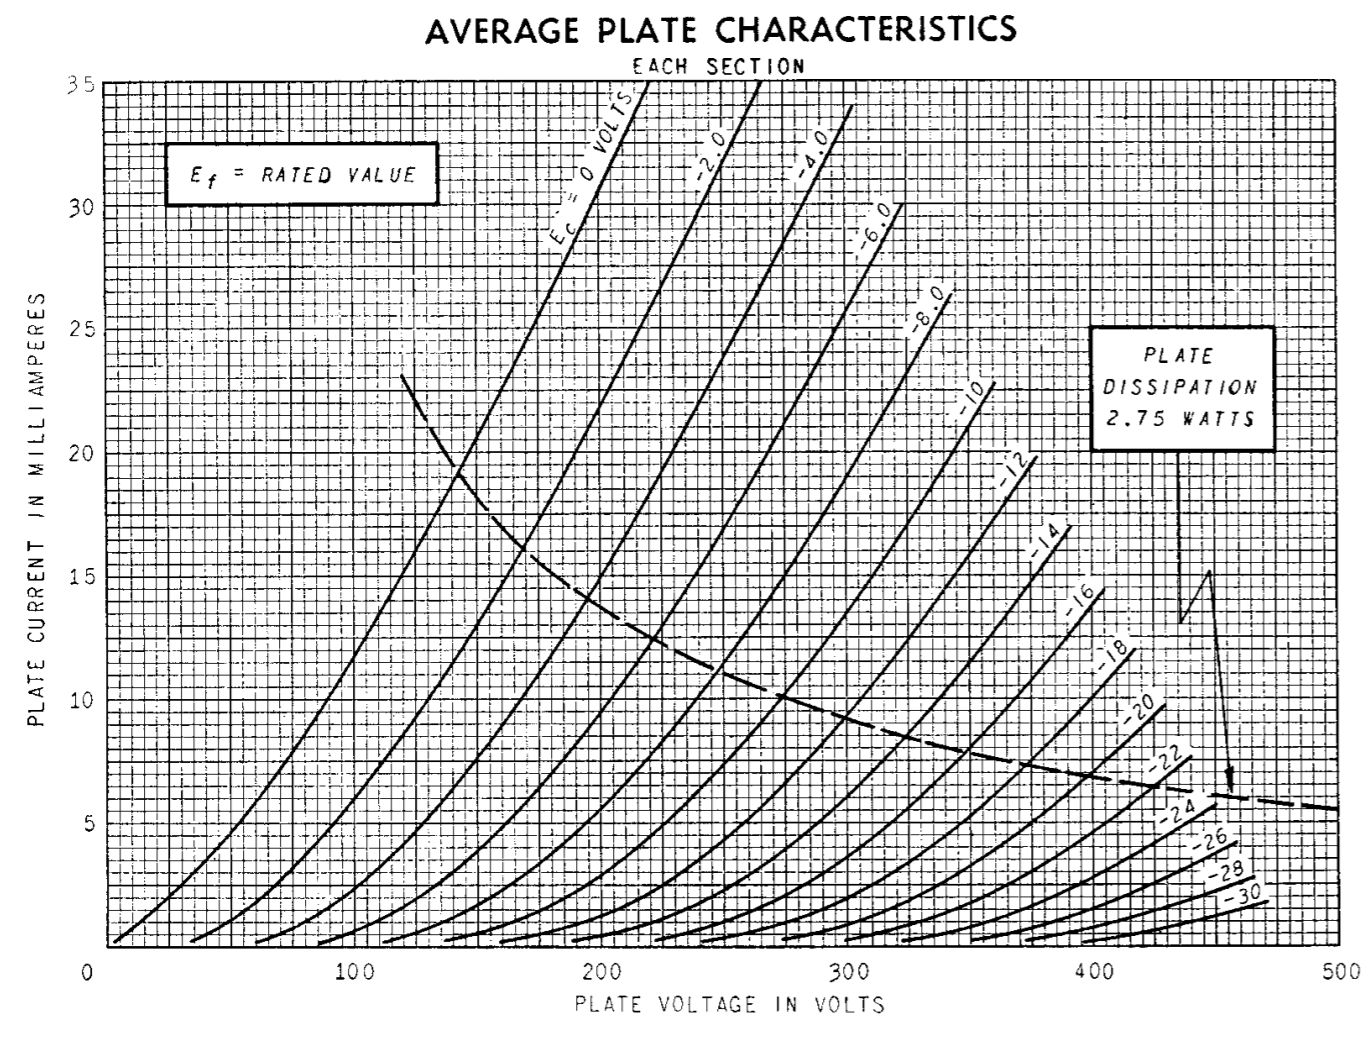
Some Average Plate Characteristics charts include a maximum plate dissipation curve but many do not. If you need to plot the dissipation curve just divide the tube's max dissipation watt rating found in the datasheet by the plate voltage to get the current and then plot the points.
To plot the max dissipation at 500 volts you divide the 12AY7's max dissipation rating of 1.5 watts (each triode) by 500 volts:
1.5W / 500V = 3 milliamps and plot the intersection of 500V and 3ma on the chart
1.5W / 450V = 3.33ma and plot the intersection of 450V and 3.33ma on the chart
1.5W / 400V = 3.75ma and plot it
and so on, then connect the dots.
To find where the curve hits the top of the chart at 7ma you can divide 1.5W by 7ma = 214.3 volts and plot 214.3V and 7ma.
12AY7 Max Plate Dissipation Curve
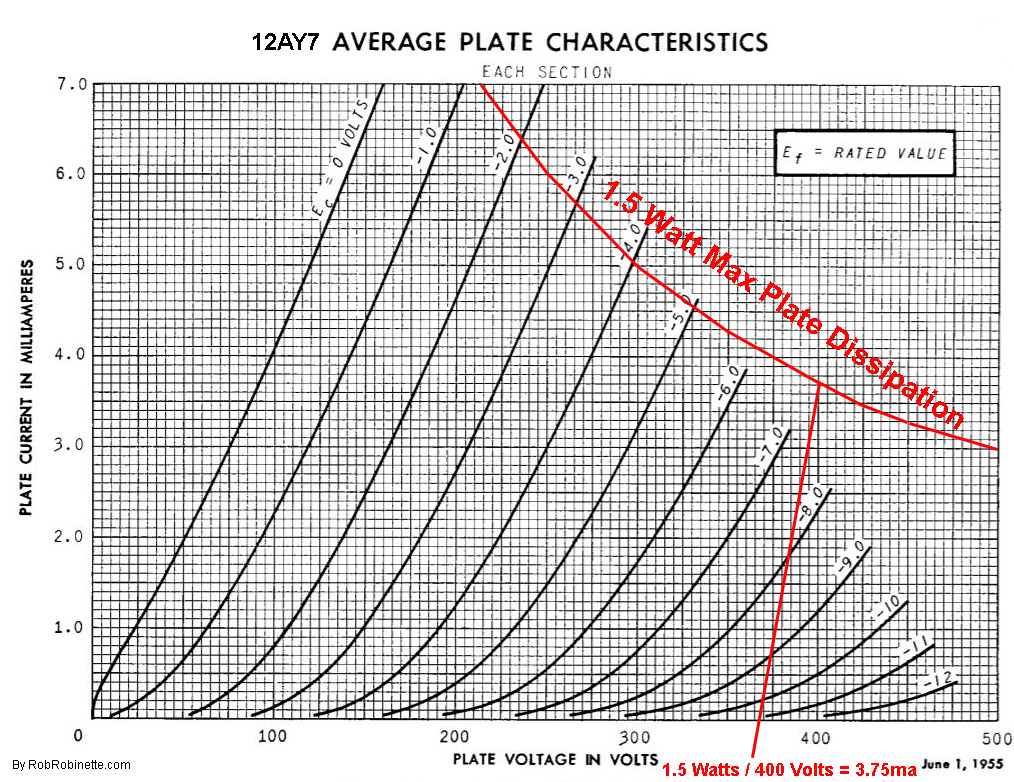
You can see the max dissipation line is very high on the chart and isn't normally a concern unless you are using the tube as a power tube.
Transconductance (gm)
Transconductance expresses the relationship between voltage change on the grid to the change in plate current. We see below that moving +/- .5 volt on the grid voltage curves results in plate current going from .28ma to 1.69ma or 1.41ma per volt.
Transconductance
![]()
The operating point is at -1.3V grid volts and we go +/- .5V for a 1 volt change on the grid (-.8V to -1.8V). This one grid volt change gives us a change of 1.69ma - .28ma = 1.41ma of plate current change per volt (shown in orange).
.00141A change * 1V change = .00141 mho of transconductance.
mu (µ)
mu is the tube's amplification factor and is a constant. The 12AX7 datasheet lists it as 100. mu is determined by the physical construction of the tube. A fine, closely spaced control grid placed very close to the cathode will generate the maximum mu. You don't need to graph the mu when you plot load lines, I just want to show how mu fits into the Average Plate Characteristics chart.
mu
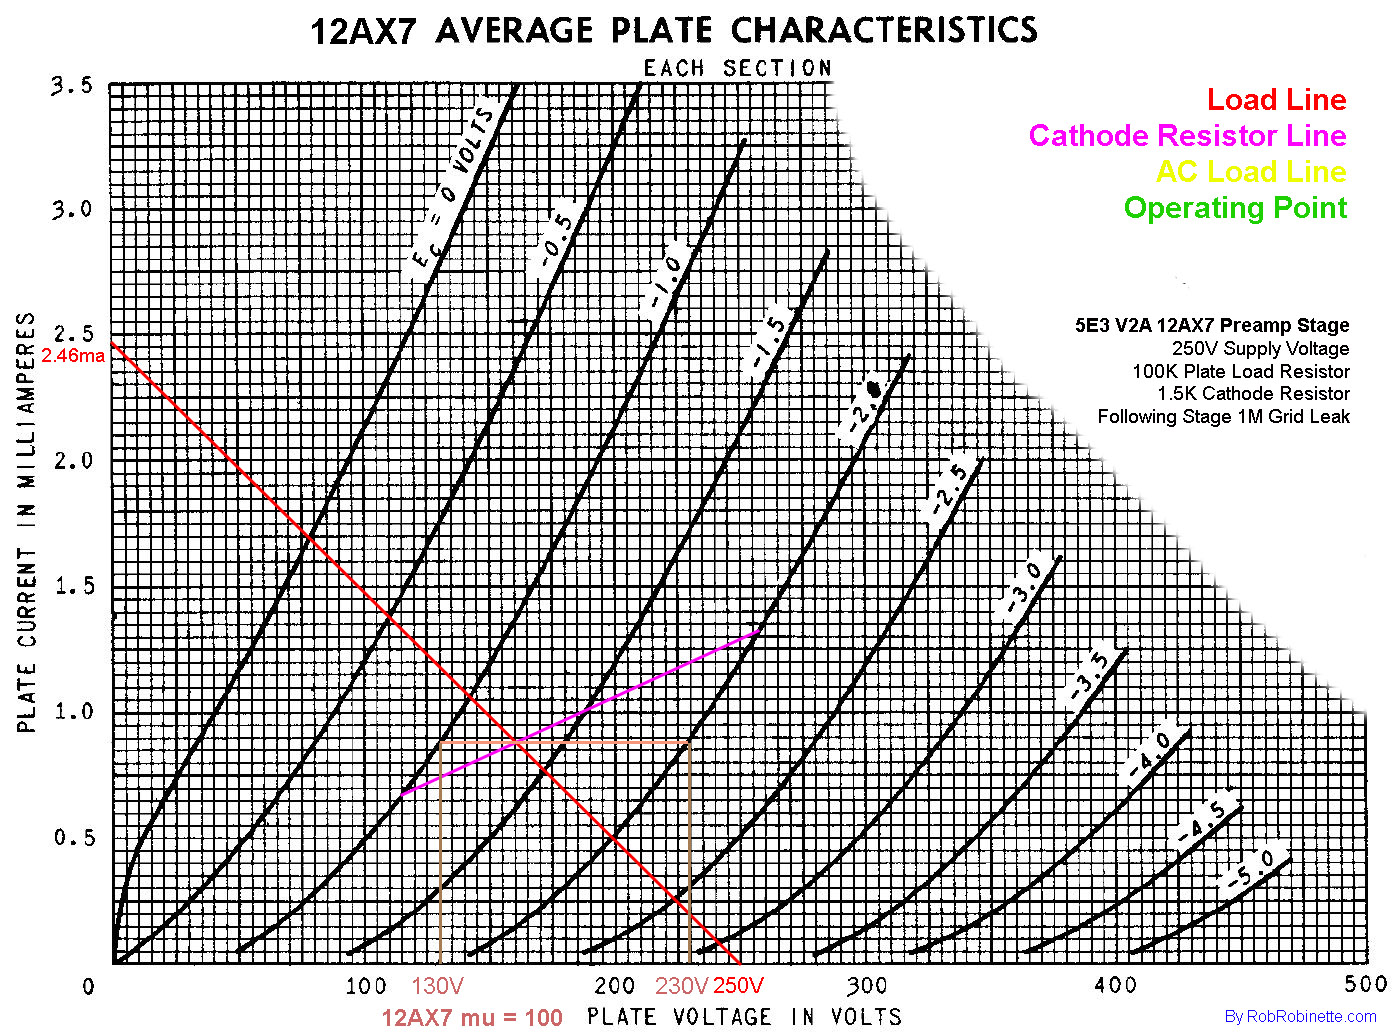
These mu lines show how it fits into the Plate Characteristics chart. We keep plate current constant at .88ma and move from the -1V grid line to the -2V grid line and get 100 volts of change. For a 12AX7 triode mu is always 100. mu represents the maximum possible gain the tube can deliver. To get a voltage gain of 100 the AC load line would have to be horizontal which is practically impossible. This is why a tube circuit's gain is always less than the tube's mu.
The Finished Product
Load Lines and Operating Point
With no AC guitar audio signal on the grid the tube idles at the operating point shown in green.
When an AC guitar audio signal hits the grid the tube's plate voltage and plate current will move along the yellow AC load line.
When the positive voltage half of the guitar signal hits the grid the grid voltage increases which means electrons are pulled from the grid wire. With fewer electrons on the grid to repel the free electrons given off by the cathode more of them will flow through the grid to the plate--the electrons are attracted to the plate's high voltage. More electrons flowing onto the plate = more plate current. More plate current increases the voltage drop across the plate load resistor--this change in voltage drop is the amplified guitar audio signal.
When the negative voltage half of the AC guitar signal hits the grid the grid voltage drops meaning electrons are pushed onto the grid wire. These extra electrons on the grid repel more free electrons and the flow of electrons through the grid decreases which reduces plate current. Less plate current causes the voltage drop across the plate load resistor to decrease. Again, this change in voltage drop is the amplified guitar audio signal.
A small guitar audio signal on the grid is amplified by the tube and plate load resistor. The plate load resistor changes the tube circuit from a current amplifier into a voltage amplifier.
For more info on how tubes work see How Tubes Work.
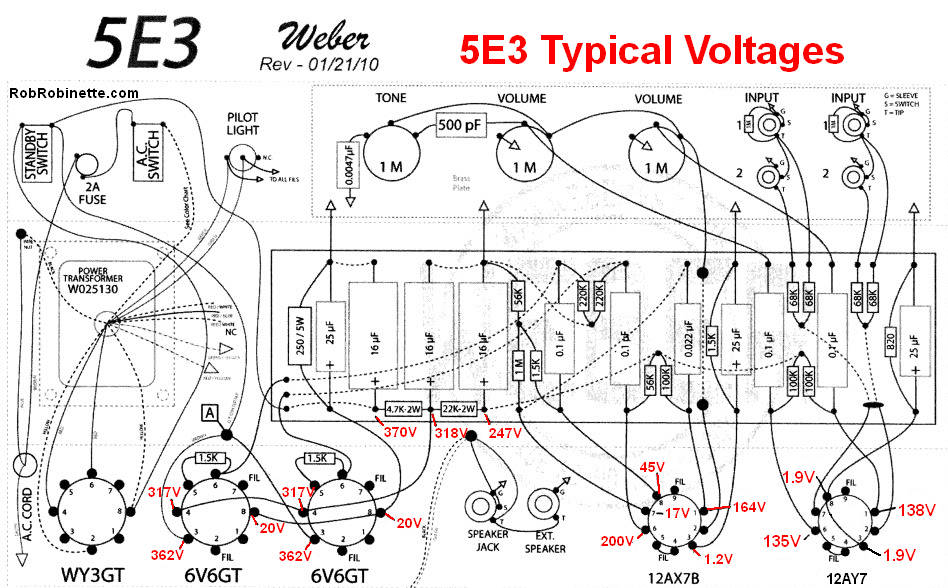
Real world 5E3 voltages. V2A's B+3 plate supply voltage is 247v, the plate voltage is 164v and the cathode voltage is 1.2v.
Our load line chart predicts an idling (no signal) plate voltage of 159v compared to 164v measured. It also predicts a cathode voltage of 1.3v with 1.2v measured. This is pretty close considering the imprecise nature of tube construction and carbon composition resistor values.
The Marshall Cold Clipper
Lets do a load line plot for the Marshall cold clipper gain stage. It's designed to generate early distortion and asymmetric clipping by clipping on the cold side of the operating point. It uses a 12AX7 with a 280V supply voltage, 10k unbypassed cathode resistor and a 100k plate load resistor. The following circuit load is a 470k attenuator resistor and 470k grid leak resistor in series for a total impedance of 940k.
V1A Cold Clipper In the Marshall JCM800
The cold clipper gain stage is shown at center. Note the 10k unbypassed cathode resistor.
Draw the Load Line
We start with the DC plate load line. The bottom point of the line is the plate supply voltage of 280 volts. We calculate the left side point by dividing the supply voltage by the total resistance (100k plate load resistor + 10k cathode resistor)
280V / 110,000Ω = .00255A or 2.55ma.
We then draw our load line from 280 volts on the bottom of the chart to 2.55ma on the left side of the chart (shown below in red).
Marshall Cold Clipper Load Lines
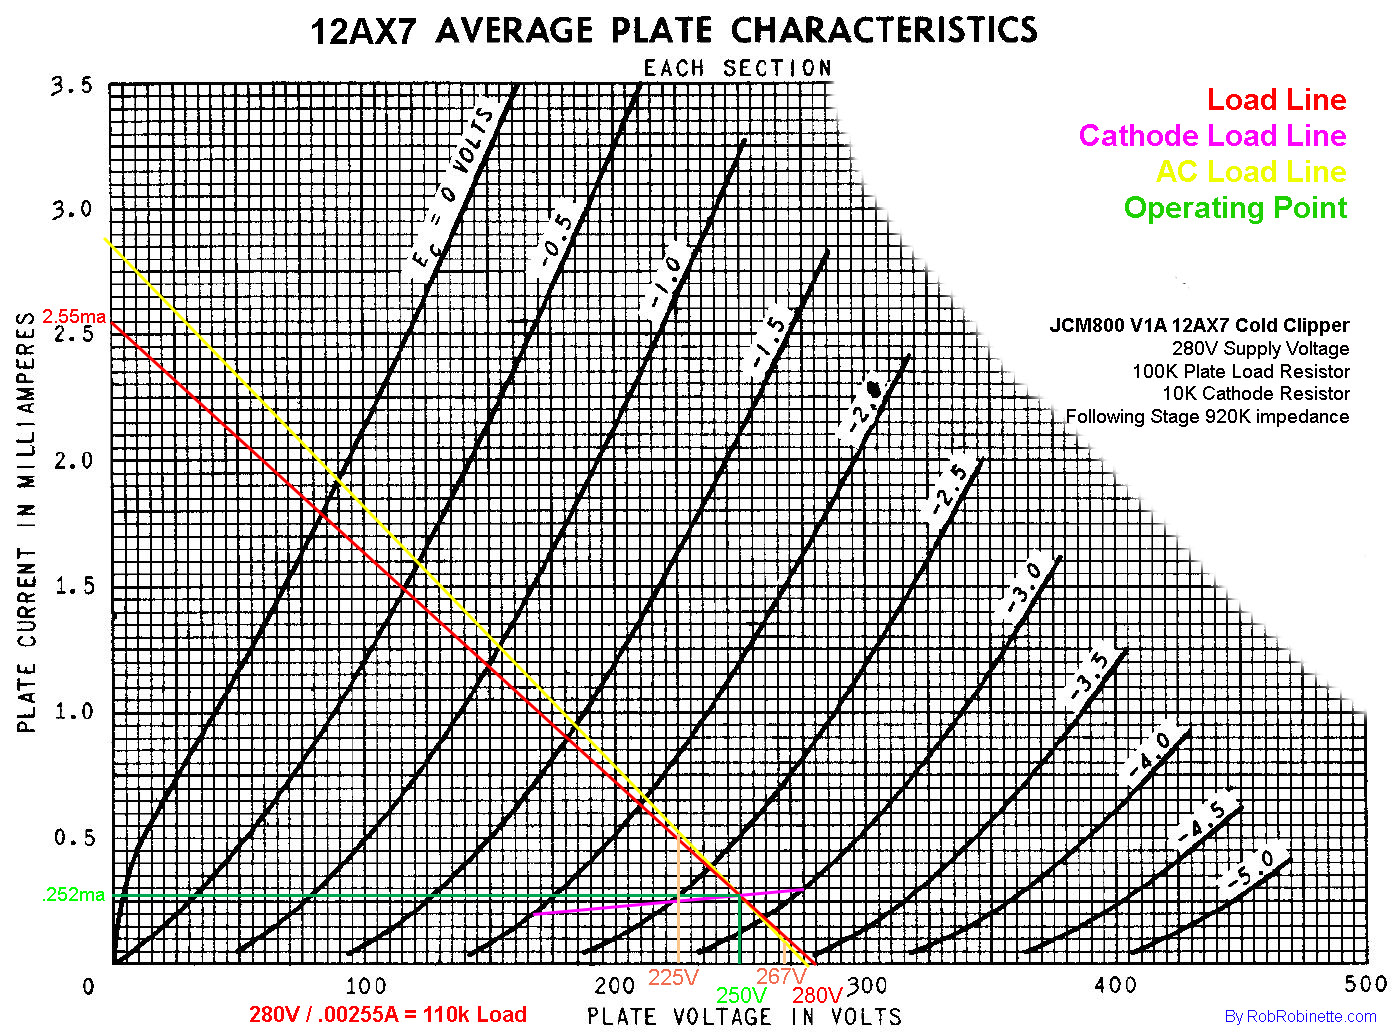
The operating point (intersection of green lines) is very low in the curvy end of the grid voltage lines so the negative half of the guitar audio signal is distorted even before clipping occurs. Guitar audio signal clipping will occur with the negative lobe of the signal voltage much earlier than the positive lobe. This gain stage's cold bias will lead to early, sweet sounding asymmetric cutoff clipping.
Draw the Cathode Load Line
Our cold clipper stage uses a 10,000Ω cathode resistor. To draw the cathode load line we'll plot two points, one on the -2V grid line and another on the -3V grid line. When I first drew this chart I tried the -1 and -2 grid voltage lines but the cathode load line didn't cross the plate load line so I had to use the -2 and -3V grid voltage lines to find the triode's operating point.
-2V grid voltage line = 2V / 10,000Ω = .20ma and plot this point on the -2V grid line.
-3V grid voltage line = 3V / 10,000Ω = .30ma and plot this point on the -3V grid line.
We then draw the cathode load line between the two plotted points (shown above in magenta). Notice how this very high cathode resistor value flattens the cathode load line--it's almost horizontal.
Draw the Operating Point
The operating point (no signal idle, quiescent point or Q point) is the intersection of the plate load line and cathode load line. It sits at 250V and .252ma with a bias voltage of -2.8V (shown in green above). Notice how low the operating point is in the chart. Down low in the chart the grid voltage lines are very curvy so even when played with no clipping the cold clipper will generate a lot of nonlinear distortion which also generates harmonic and intermodulation distortion. There's very little headroom below and to the right of the operating point causing signal distortion and clipping which is the primary purpose of the cold clipper.
Draw the AC Load Line
Before we can determine cold clipper voltage gain we must first plot the AC load line. The AC load on the cold clipper equals: plate load resistor + cathode resistor in parallel with the impedance of the following circuit. In the JCM800 the following circuit's impedance is 940k as discussed above.
plate load 100k + cathode resistor 10k || following stage 940k (we include the cathode resistor because it is not bypassed with a cap)
The equation is: 1 / (1/110k + 1/940k) = 98k impedance
We calculate the AC current: 280V / 98k = 2.84ma
We now draw the AC load line from 280v on the bottom of the chart to 2.84ma on the left.
We then slide the AC load line to the left until it intersects with our operating point (shown above in yellow). Keep the AC load line's slope the same, just slide it to the left.
Chart the Voltage Gain
Go .5 grid volt left and right along the AC load line and drop down to get the plate voltages. 267 volts - 225 volts = a voltage gain of 42, so for a 1 AC volt peak-to-peak change on the grid we'll get 42 volts of plate voltage change. 1 volt in is amplified into 42 volts out. This voltage gain is quite a bit lower than our 5E3 gain stage above of 58. The primary reason for the lower gain is the tighter spacing of the grid voltage curves down low in the chart. The 10k cathode resistor shifts the operating point down and to the right compared to the 5E3 Deluxe's 1.5k cathode resistor. As you move down and to the right in the chart the grid voltage curve spacing becomes much tighter which reduces voltage swing and therefore voltage gain.
Cathodyne Phase Inverter
The cathodyne phase inverter circuit in the Fender 5E3 Deluxe is used in many other amps. It's primary advantage is it only requires one half of a preamp tube (one triode). The cathodyne phase inverter is very similar to a simple cathode follower except half of the load resistance is placed on the cathode and half on the plate so half of the voltage swing is on the cathode and half on the plate.
The cathodyne phase inverter's total differential gain is slightly less than 2.
To draw a cathodyne phase inverter's load lines we have to consider the tail load resistance and how the tail load resistor affects the cathode and grid voltages.
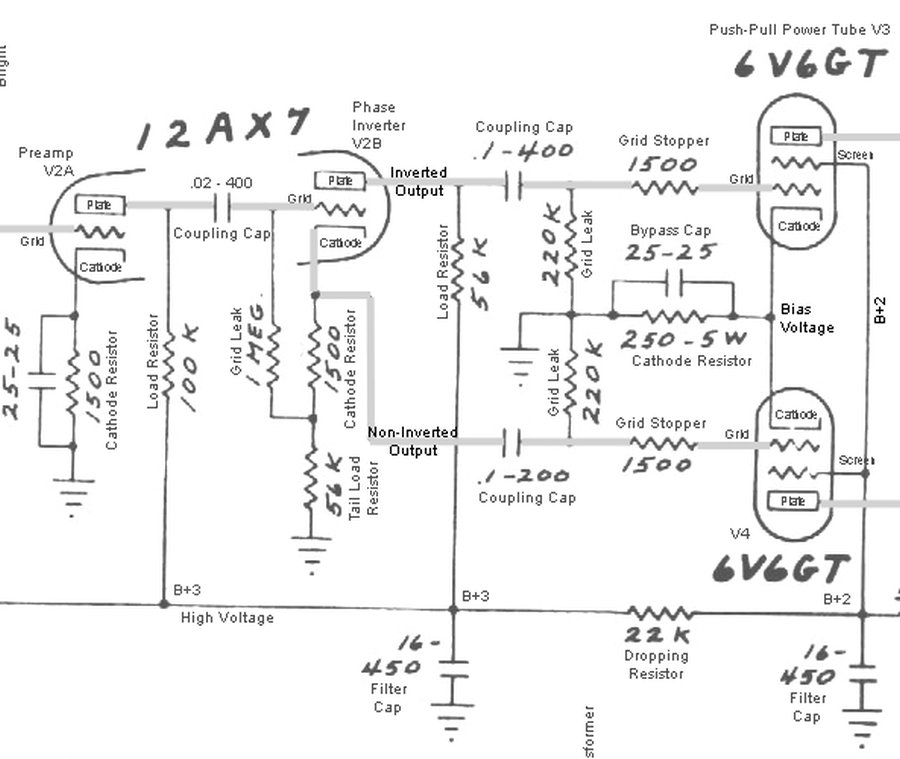
V2B (upper center) is the cathodyne phase inverter circuit.
Draw the Load Line
We start with the DC plate load line. The bottom point of the line is the B+3 supply voltage of 250 volts. We calculate the left side point by dividing the supply voltage by the total resistance (56k tail load resistor + 1.5k cathode resistor + 56k plate load resistor)
250V / 113,500Ω = .0022A or 2.2ma.
We then draw our load line from 250 volts on the bottom of the chart to 2.2ma on the left side of the chart (shown below in red).
Cathodyne Phase Inverter Chart
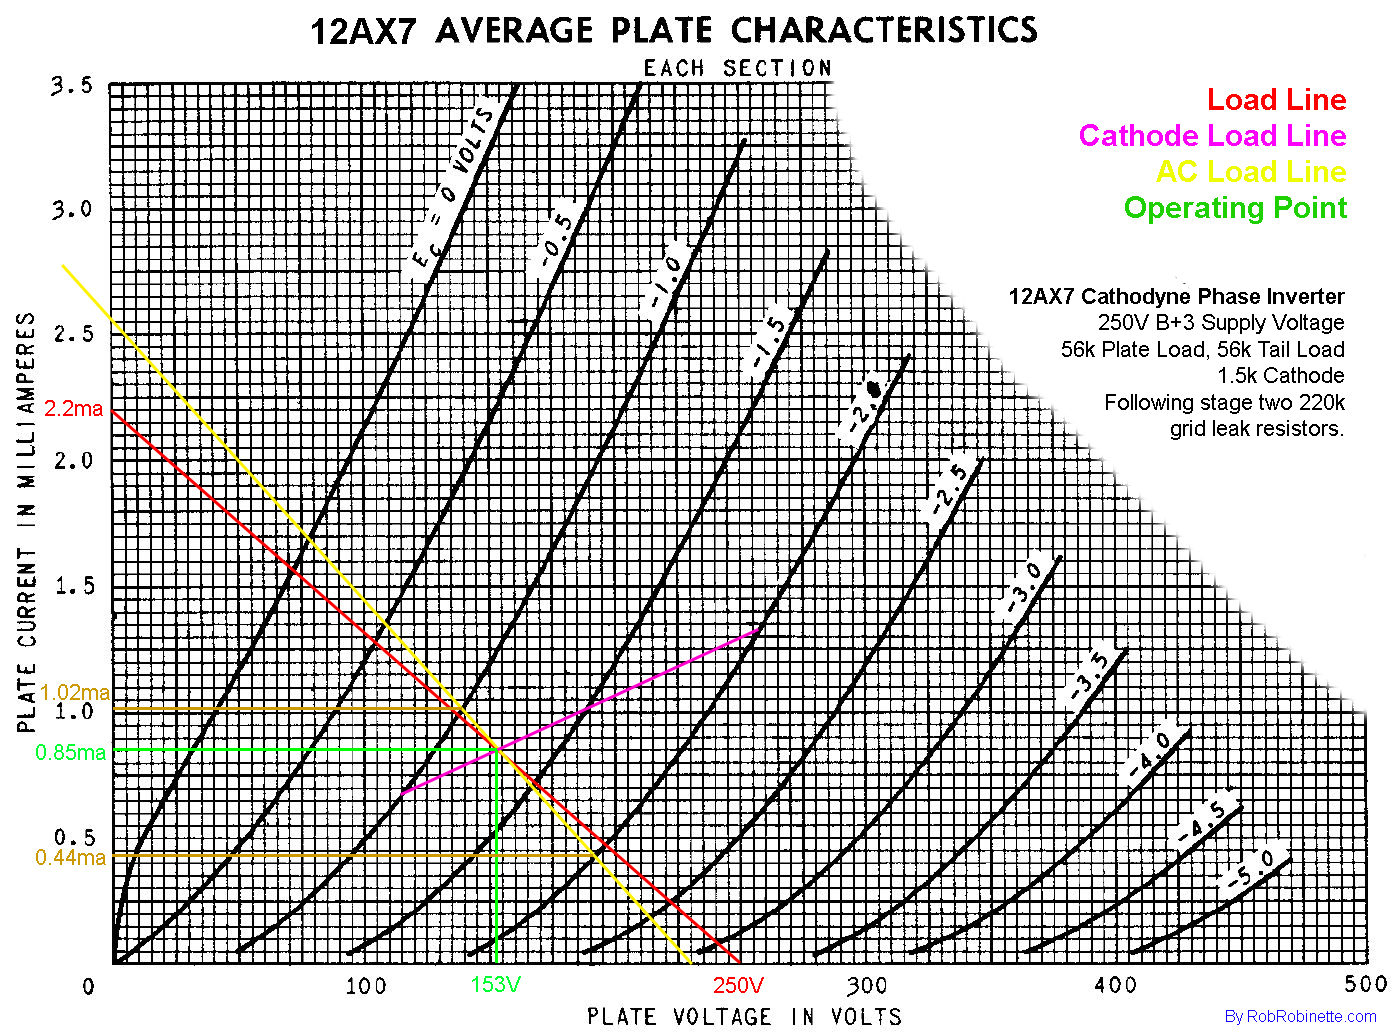
12AX7 with 56k tail load resistor, 1.5k cathode resistor and 56k plate load resistor.
Draw the Cathode Load Line
The 5E3 cathodyne phase inverter uses a 1,500Ω cathode resistor (we ignore the 56k tail load resistor for now). To draw the cathode load line we'll plot two points, one on the -1V grid line and another on the -2V grid line.
-1V grid line = 1V / 1,500Ω = .67ma and plot this point on the -1V grid line.
-2V grid line = 2V / 1,500Ω = 1.33ma and plot this point on the -2V grid line.
We then draw the cathode load line between the two plotted points (shown above in magenta).
Draw the Operating Point
The operating point (no signal idle, quiescent point or Q point) is the intersection of the plate load line and cathode load line. It sits at 153V and 0.85ma with a bias voltage (voltage difference between the cathode and grid) of -1.25V.
Draw the AC Load Line
Before we can determine cathodyne phase inverter stage voltage gain we must first plot the AC load line. The AC load equals: tail load resistor + cathode resistor + plate load resistor in parallel with the impedance of the following circuit. In the 5E3 the following circuit's impedance is set by the two 220k power tube grid leak resistors. To be completely accurate we need to calculate the impedance for the cathode and plate separately and then add them together:
Cathode
tail load 56k resistor + cathode resistor 1.5k || 220k grid leak resistor ( || means "in parallel with")
The equation is: 1 / (1/57.5k + 1/220k) = 45.5k cathode impedance
Plate
plate load resistor 56k resistor || 220k grid leak resistor
The equation is: 1 / (1/56k + 1/220k) = 44.6k plate impedance
We can now calculate the AC current:
plate supply voltage / (cathode impedance + plate impedance)
250V / (45.5k + 44.6k)
250V / 90.1k = 2.77ma
We then draw the AC load line from 250v on the bottom of the chart. 250 volts is the B+3 plate supply voltage and represents the triode in cutoff (no current flow so no voltage drop across the plate load resistor).
The other end of the AC load line is the calculated 2.77ma on the left edge of the chart.
After drawing the AC load line we must slide the line to the left until it intersects with our operating point (shifted AC load line shown above in yellow). This is easy to do in some programs like Adobe Photoshop but others like irfanview don't allow it. Keep the AC load line's slope the same, just slide it to the left.
Chart the Voltage Gain
This is where things get tricky with a cathodyne phase inverter. We have to consider that the voltages on the cathode and grid are affected by the voltage drop across the tail load resistor but the grid voltage curves shown on the chart are simply the voltage difference between the grid voltage and cathode voltage. Because of this we can't calculate gain the same way we graphed it out with the normal gain stage shown above in the first section.
To determine the cathodyne gain we find the point where the AC load line crosses the chart's -1 grid curve, move left on the chart to get the plate current of 1.02ma (tan line on chart). The cathode resistor current and tail load resistor current are also 1.02ma.
Cathode voltage = 1.02ma x 56k = 57.1V
Grid voltage = voltage difference between the grid and cathode + cathode voltage
Grid voltage = -1V + 57.1V = 56.1V
Now we do the same thing on the other side of the operating point and use the chart's -2V grid curve. We find the point where the AC load line crosses the -2V curve, move left on the chart to get the plate current of 0.44ma (tan line on chart).
Cathode voltage = 0.44ma x 56k = 24.6V
Grid voltage = voltage difference between the grid and cathode + cathode voltage
Grid voltage = -2V + 24.6V = 22.6V
Now we can calculate the cathodyne phase inverter's gain:
Gain = change in cathode voltage / change in grid voltage
Gain = (57.1V - 24.6) / (56.1V - 22.6V)
Gain = 32.5V / 33.5V = 0.97 (slightly less than unity or 1)
We calculate the cathodyne phase inverter's differential gain by adding the plate gain (slightly less than 1) and the cathode gain (slightly less than 1) which equals slightly less than 2. A typical Long Tail Pair phase inverter has a differential gain of around 30.
We need to do two more simple calculations to come up with our actual cathode and grid voltages. Our chart above shows the operating point at 153 volts but when we measure the actual plate voltage of a 5E3 Deluxe cathodyne phase inverter we find it is typically 200v. That's because we have to add the voltage drop across our 56k tail resistor.
Operating Point Cathode voltage = Operating Point current x Tail Load resistance = 0.85ma x 56k = 47.6v
Plate voltage of 153v + Operating Point Cathode voltage of 47.6v = 200.6v which matches our real world measurement.
Our grid voltage will be:
Cathode voltage of 47.6v - Operating Point Bias voltage of 1.25v = 46.35v
Note that it is not possible with most multi-meters to accurately measure the grid voltage. The meter's impedance will throw off the measurement.
There's a dual action going on at the grid. An AC guitar signal on the cathodyne's grid changes the current flow through the tube like normal but that current flow causes a voltage drop across the tail load resistor that changes the cathode voltage. This cathode voltage swing is what allows the cathodyne to pass an undistorted signal that is many times greater than the 1.2v bias voltage would imply.
The voltage difference between the grid and cathode makes the current change and the cathode voltage moves at 0.97 of the grid signal (3% loss).
The action on the plate is much more conventional. The plate resistor converts cathode current into voltage drop by Ohm's law just like a normal gain stage.
The voltage drop caused by the 1.5k cathode resistor causes most of the -3% signal loss through the 5E3 cathodyne phase inverter. The signal on the cathode tracks the signal on the grid minus the loss from the cathode resistor. The cathodyne's differential gain will always be less than 2 (2 x unity) due to the loss caused by the cathode resistor and its bias voltage. We can use fixed bias on the cathodyne grid and eliminate the cathode resistor and get closer to 100% signal output (unity gain) but internal losses in the tube itself prevent us from attaining unity.
56k tail load and plate load resistors work well with 6V6 and EL84 power tubes. To drive big bottle power amps like the 6L6 moving up to 100k tail and plate loads will provide more voltage swing. Gain will still be below 2 but a larger signal on the cathodyne grid can pass through the phase inverter to hit the power tube grids harder. The gain stage prior to the cathodyne phase inverter must provide the signal swing to drive the power tubes because the cathodyne will add little gain.
Tubes with low internal resistance like the 12AU7 will also have a gain of less than 2 but they can give more voltage swing into low impedance loads.
The Lead Channel Mod
The "Lead Channel Mod" for the 5E3 Deluxe, blackface, silverface and many other amps changes one channel's first gain stage to use a 12AX7 with a 2.7k cathode resistor, 220k plate load resistor, smaller .68uF cathode bypass cap and a smaller .0047uF coupling cap. The mod adds some gain and early harmonic distortion and makes asymmetric clipping distortion more likely.
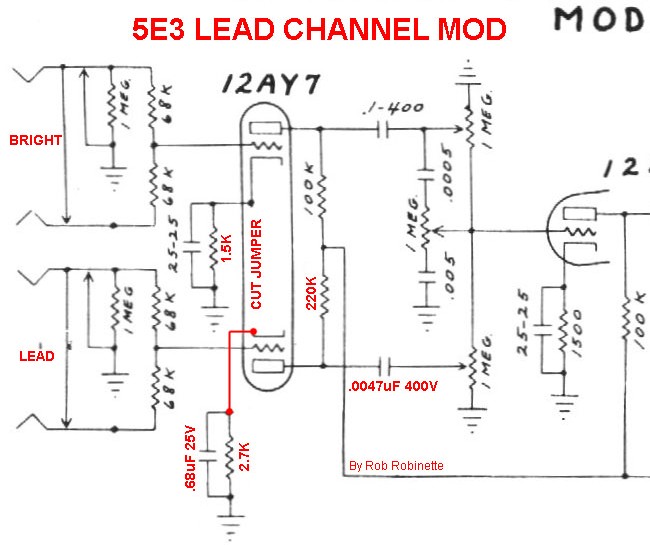
The lower "Lead" channel has a 2.7k cathode resistor and 220k plate load. The following circuit impedance is made up of two 1M volume pots in parallel. The schematic shows a 12AY7 tube but a 12AX7 is a common substitute for higher gain players.
Draw the Load Line
We start with the DC plate load line. The bottom point of the line is the plate supply voltage of 250 volts. We calculate the left side point by dividing the supply voltage by the total resistance (220k plate load resistor + 2.7k cathode resistor)
250V / 222,700Ω = .00112A or 1.12ma.
We then draw our load line from 250 volts on the bottom of the chart to 1.1ma on the left side of the chart (shown below in red). Notice how this very high plate load resistor flattens out the load line for more voltage gain.
Lead Channel Mod Chart
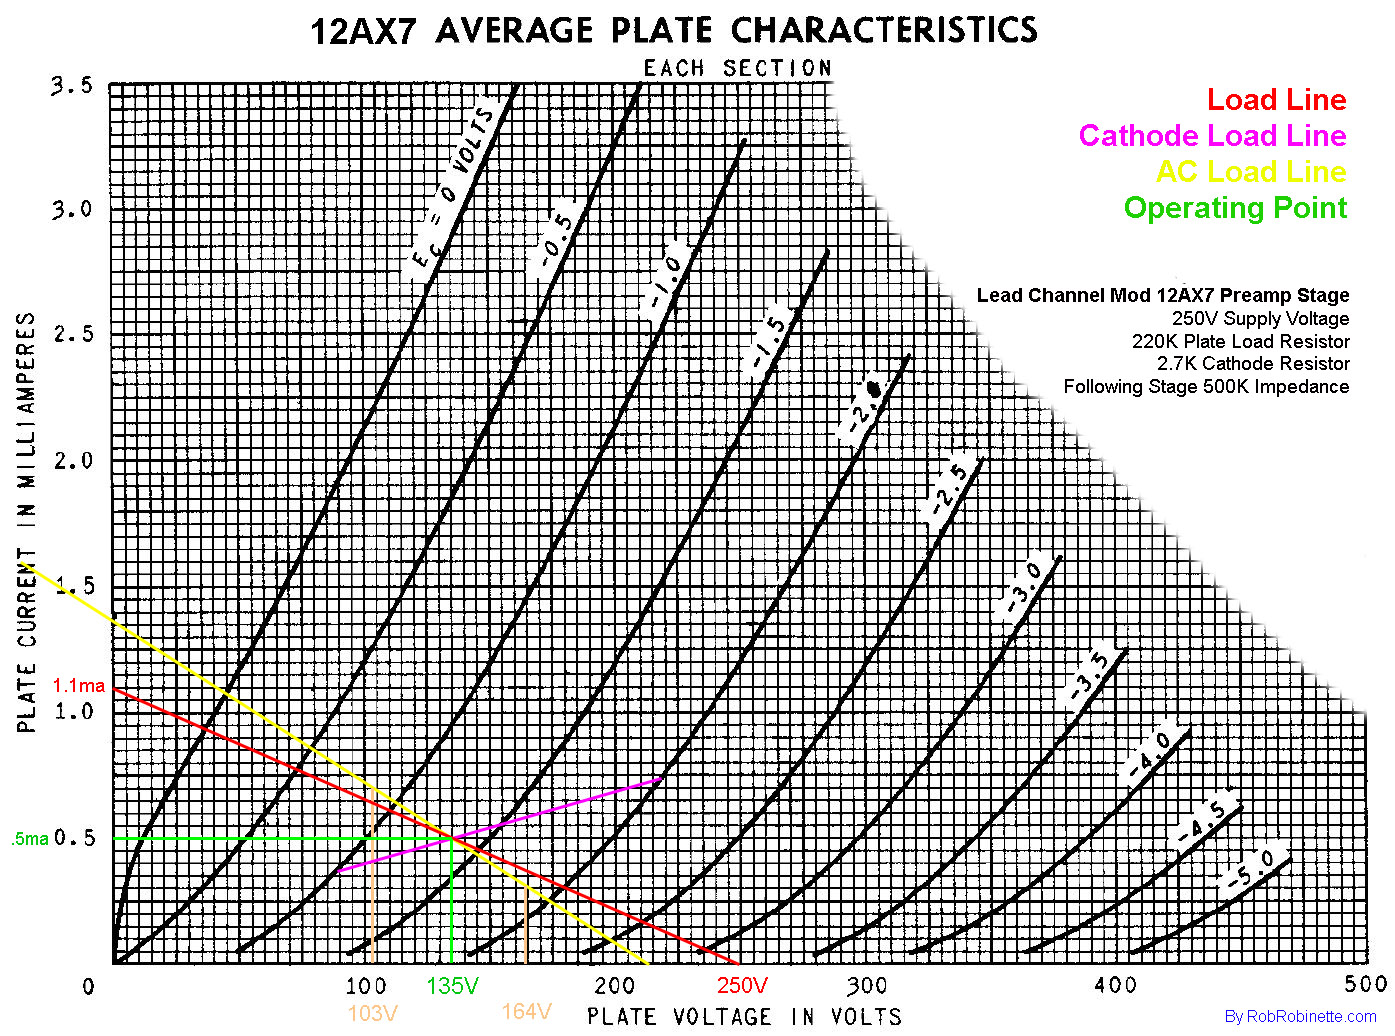
12AX7 with 2.7k cathode resistor and 220k plate load resistor.
Draw the Cathode Load Line
The Lead Channel stage uses a 2,700Ω cathode resistor. To draw the cathode load line we'll plot two points, one on the -1V grid line and another on the -2V grid line.
-1V grid line = 1V / 2,700Ω = .37ma and plot this point on the -1V grid line.
-2V grid line = 2V / 2,700Ω = .74ma and plot this point on the -2V grid line.
We then draw the cathode load line between the two plotted points (shown above in magenta).
Draw the Operating Point
The operating point (no signal idle, quiescent point or Q point) is the intersection of the plate load line and cathode load line. It sits at 135V and .5ma with a bias voltage of -1.3V.
Notice how there's 2.7 volts from the operating point to the 0V grid curve and 3.4 volts from the operating point to the bottom of the chart (cutoff). A larger cathode resistor of 3.3k would get us closer to center bias for a little more headroom but the purpose of the Lead Channel mod is to add gain AND distortion.
Draw the AC Load Line
Before we can determine Lead Channel stage voltage gain we must first plot the AC load line. The AC load equals: plate load resistor + cathode resistor in parallel with the impedance of the following circuit. In the 5E3 the following circuit's impedance changes with the volume setting. With the Lead Channel volume pot at max the impedance is 500k (impedance of both 1M volume pots in parallel) so we'll use this for the chart.
plate load 220k || 500k
The equation is: 1 / (1/220k + 1/500k) = 153k impedance
We calculate the AC current: 250V / 153k = 1.63ma
We then draw the AC load line from 250v on the bottom of the chart to 1.63ma on the left.
We must slide the AC load line to the left until it intersects with our operating point (shifted AC load line shown above in yellow). Keep the AC load line's slope the same, just slide it to the left.
Using a higher value plate load resistor will boost gain but it also adds impedance making our guitar audio signal "thinner" with less current backing up the signal voltage swing.
Chart the Voltage Gain
Go 1/2 grid volt left and right along the AC load line and drop down to get the plate voltages. 164 volts - 103 volts = a voltage gain of 61, so for a 1 AC volt peak-to-peak change on the grid we'll get 61 volts of plate voltage change. 1 volt in is amplified into 61 volts out. Using a 220k plate load resistor gives us slightly more voltage gain than the factory gain stage of 58.
Warm Biased 12AX7
Let's draw the load lines for another common gain stage, a 12AX7 with an 820 ohm cathode and 100k plate load resistor.
Draw the Load Line
We start with the DC plate load line. The bottom point of the line is the plate supply voltage of 280 volts. We calculate the left side point by dividing the supply voltage by the total resistance (100k plate load resistor + 820Ω cathode resistor)
280V / 100,820Ω = .00278A or 2.78ma.
We then draw our load line from 280 volts on the bottom of the chart to 2.78ma on the left side of the chart (shown below in red).
Warm Biased 12AX7 Gain Stage
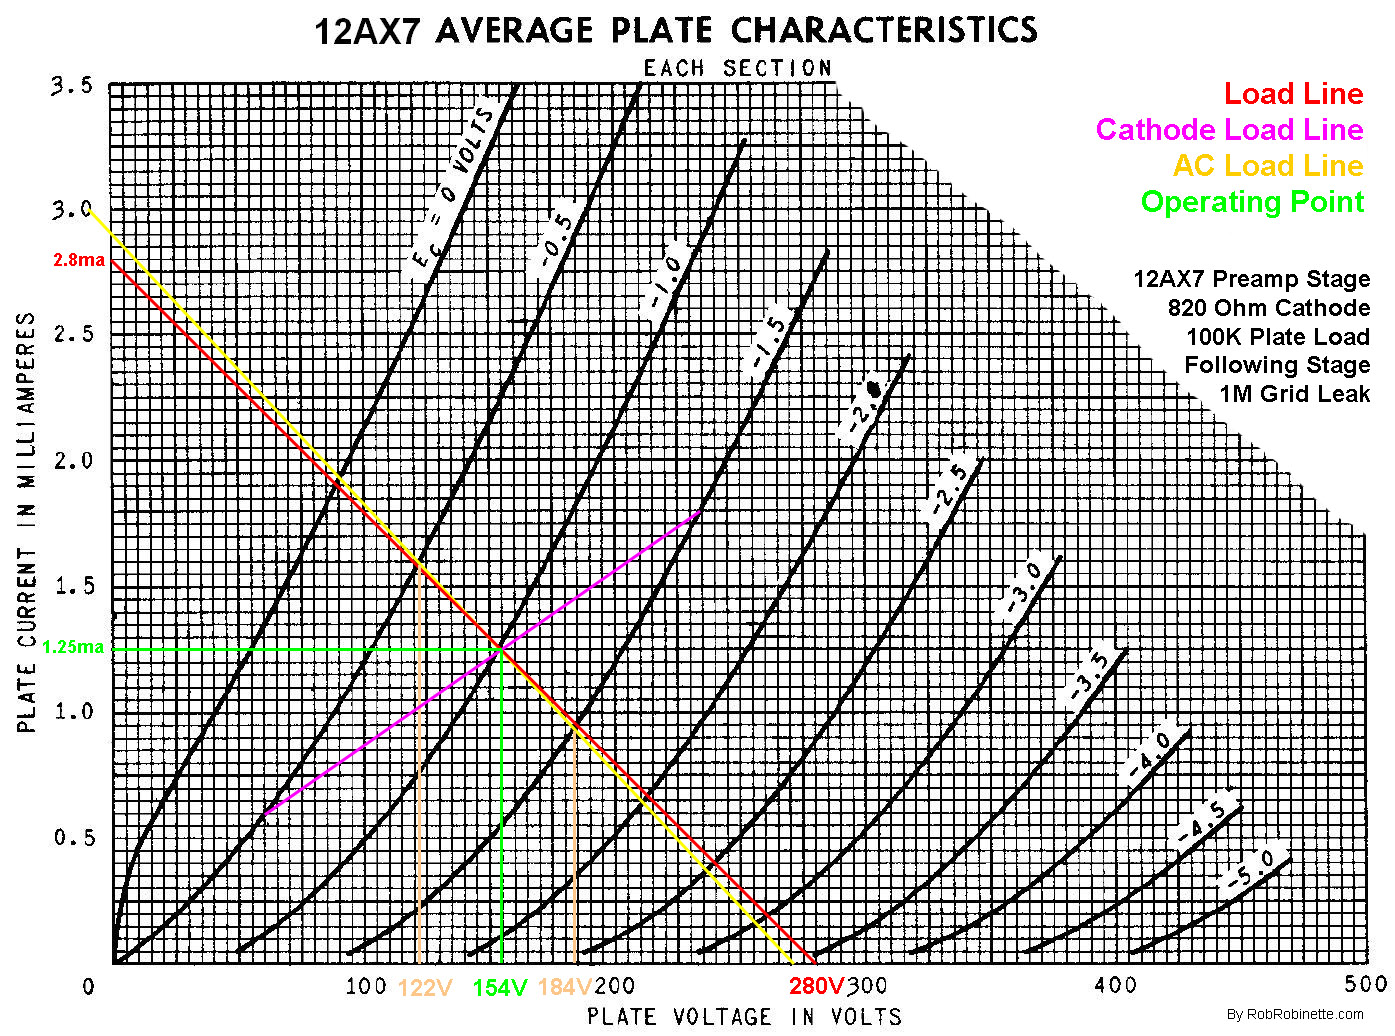
12AX7 with an 820Ω cathode resistor, 100k plate load resistor and 280V supply voltage. The bias point is further up the load line at -1V on the grid so the AC guitar signal can swing from 0 grid volts to -2V without clipping. The positive half of the AC guitar signal will be clipped earlier at saturation or grid clipping before the negative half of the signal is clipped at cutoff.
Draw the Cathode Load Line
Our 12AX7 is warm biased with an 820Ω cathode resistor. To draw the cathode load line we'll plot two points, one on the -.5V grid line and another on the -1.5V grid line.
-.5V grid line = .5V / 820Ω = .61ma and plot this point on the -.5V grid line.
-1.5V grid line = 1.5V / 820Ω = 1.83ma and plot this point on the -1.5V grid line.
We then draw the cathode load line between the two plotted points (shown above in magenta).
Draw the Operating Point
The operating point (no signal idle, quiescent point or Q point) is the intersection of the plate load line and cathode load line. It sits at 154V and 1.25ma and -1V grid voltage with a bias voltage of -1V.
Notice how there's 1 volt from the operating point to the 0V grid curve and 2.6 volts from the operating point to the bottom of the chart (cutoff). The operating point is higher and to the left in the warm bias region. An overdriven guitar signal will clip at saturation and grid clipping (0 volt grid) before it is clipped at cutoff (bottom of the chart).
Draw the AC Load Line
The AC plate load equals: plate load resistor + cathode resistor in parallel with the impedance of the following circuit. To keep things generic we'll say there is a 1M grid leak in the following circuit.
plate load 100k || 1M
The equation is: 1 / (1/100k + 1/1M) = 91k impedance
We calculate the AC current: 280V / 92k = 3.07ma
We then draw the AC load line from 280v on the bottom of the chart to 3.07ma on the left.
We must slide the AC load line to the left until it intersects with our operating point (shifted AC load line shown above in yellow). This is easy to do in some programs like Adobe Photoshop but others like irfanview don't allow it. Keep the AC load line's slope the same, just slide it to the left.
Chart the Voltage Gain
We go .5 grid volt left and right along the AC load line and drop down to get the plate voltages. 184 volts - 122 volts = a voltage gain of 62, so for a 1 AC volt peak-to-peak change on the grid we'll get 62 volts of plate voltage change. 1 volt in is amplified into 62 volts out. Using a warm bias with an 820Ω cathode resistor gives us slightly more voltage gain than the typical gain stage with a 1.5k cathode resistor's voltage gain of 58.
As we warm the bias the operating point moves left on the chart where the grid curves are wider spaced. With this wider spacing a warmer bias yields higher gain because the wider spacing gives you more voltage swing.
As you cool the bias the operating point moves right on the chart where the grid curves are spaced closer together for less voltage swing and gain.
12AX7 Max Gain Stage
Here's a max effort to get the most gain and clean headroom out of a preamp stage by using a 12AX7 with a high supply voltage of 410 volts, a large 270k plate load resistor and 4.3k cathode resistor. Although the 12AX7 datasheet lists the maximum plate voltage at 300 volts these tubes run fine with much higher plate voltages (see the Fender tremolo oscillator below with 415V on the plates). We'll say the following circuit has an impedance of a 1M grid leak resistor.
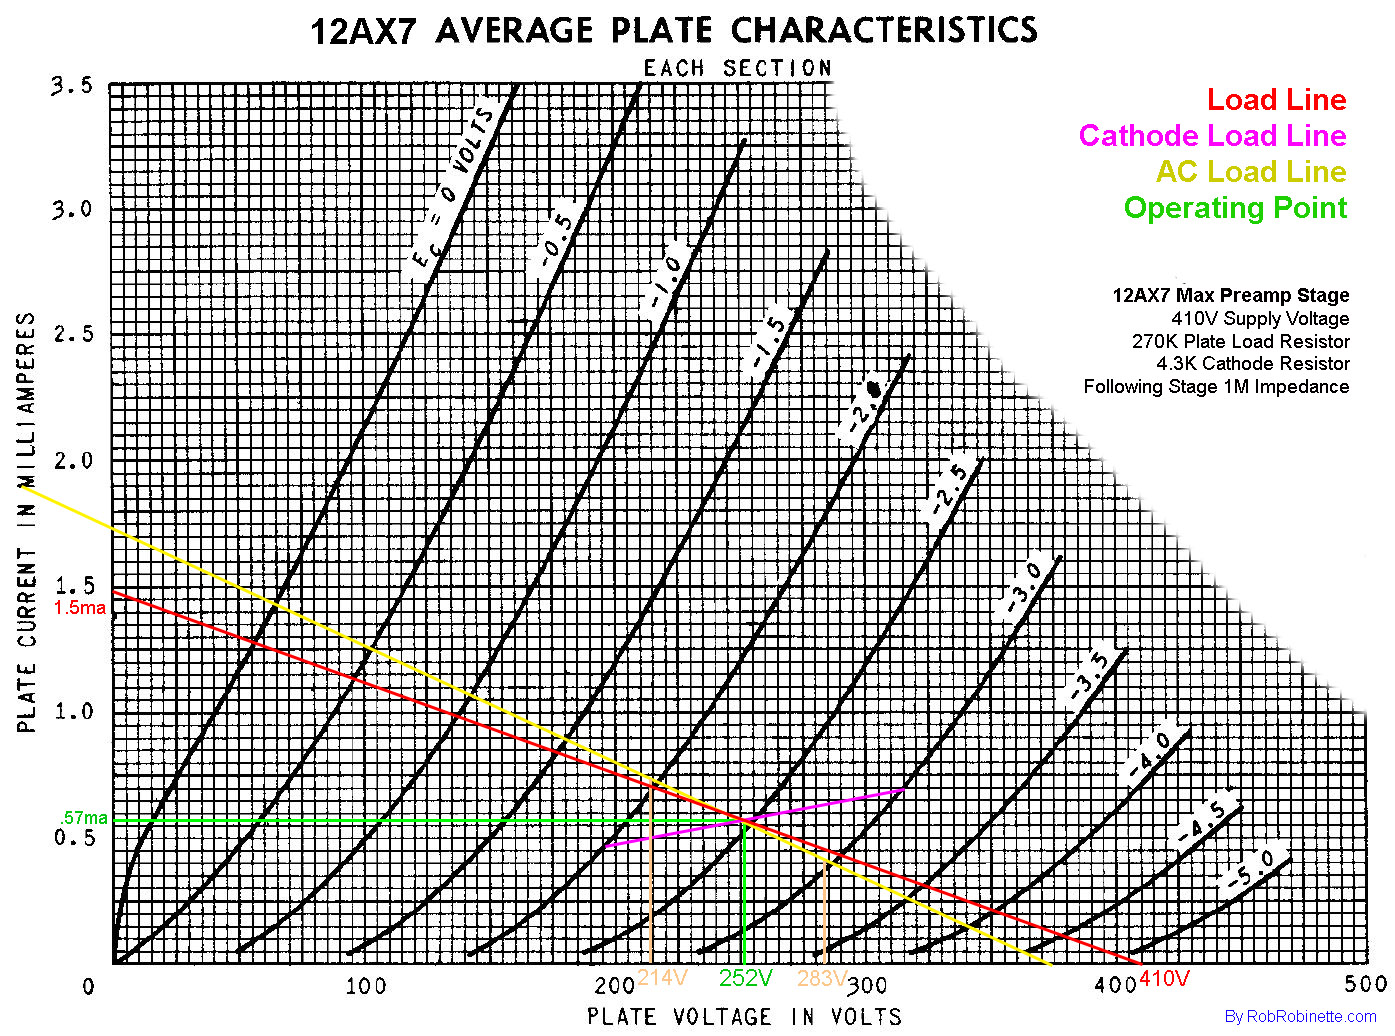
A very high supply voltage, large value plate load resistor and cathode resistor yield a voltage gain of 69 and we have a very wide grid voltage swing available of 0 to -4.7 volts for lots of clean headroom. This gain stage is center biased at -2.4 grid volts allowing a 4.7V peak-to-peak signal before symmetric clipping occurs.
DC plate current = 410V / (270k + 4.3k) = 1.50ma
Cathode load line points
-2V / 4300Ω = .47ma
-3V / 4300Ω = .70ma
AC plate current = 410V / (1/( 1/(270k) + 1/1M)) = 1.92ma
Voltage gain = 283V - 214V = 69 with 100 being max theoretical gain (12AX7 mu)
AB763 Tremolo Oscillator
Fender AB763 blackface and silverface amps use a 12AX7 as a tremolo oscillator with a very high supply voltage of 415V, a large 220k plate load resistor and 2.7k cathode resistor. The following circuit has an impedance of 429k. The 12AX7 datasheet lists the maximum plate voltage as 300 volts. This is the hottest factory 12A*7 gain stage I know of.
AB763 Tremolo Oscillator
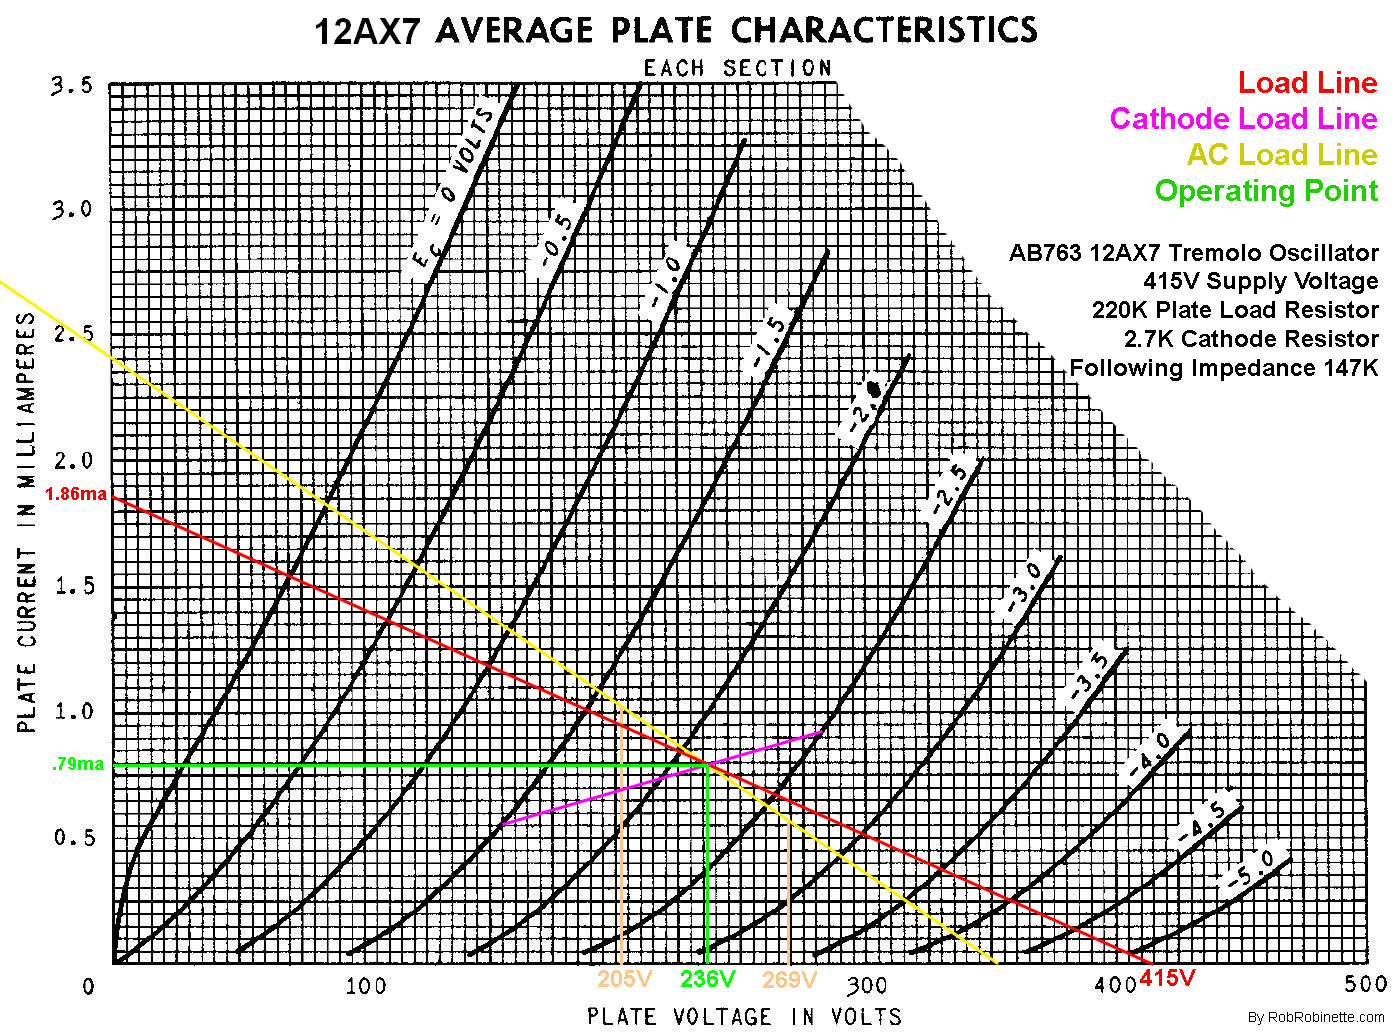
An extremely high supply voltage, large value plate load resistor and cathode resistor yield a voltage gain of 64, not that much higher than the typical gain stage's 58. This gain stage is near center bias at -2.2 grid volts allowing a swing from 0 to -4.4 grid volts before saturation or grid clipping occurs near 0 grid volts.
DC plate current = 415V / (220k + 2.7k) = 1.86ma
Cathode load line points
-1.5V / 2700Ω = 5.56ma
-2.5V / 2700Ω = 9.26ma
AC plate current = 415V / (1/( 1/(220k) + 1/1M)) = 2.3ma
Voltage gain = 269V - 205V = 64
This stage is pushed well beyond the max plate voltage of 300 volts but the tubes hold up well in blackface and silverface amps.
5E3 Deluxe 6V6GT Power Tube
Plotting the load lines for a pentode power tube used in a Class AB push-pull amp like the Fender 5E3 Deluxe is a little more complex than plotting the load lines for a triode.
My 5E3 Deluxe plugged into a 125V outlet has a B+1 voltage of 368, plate voltage of 360, plate-to-cathode voltage of 340, screen-to-cathode voltage of 300 and 20 volts on the cathode (-20 volt grid bias). The cathode resistor is 250 ohm 5 watts and the output transformer plate-to-plate impedance is 8k (RLoad).
The 5E3's cathode is at 20 volts so our plate-to-cathode voltage is 360 - 20 = 340 volts. We use the plate-to-cathode voltage in the chart because the voltage difference between the plate and cathode is what matters. If our 5E3 used fixed bias the cathode would be grounded at 0 volts so the plate-to-cathode voltage would equal the plate voltage of 360 volts. We start by drawing our bias line (green) vertically up from our plate-to-cathode voltage of 340.
The typical 5E3 is biased with 20 volts on the cathode. The grid voltage is at -20 volts compared to the cathode so we come up along the bias line from 340 volts until we intercept the -20V grid curve. That point, the idle point, bias point, quiescent or Q point is at 95% of the 6V6GT 12 watts maximum dissipation rating. The Max Dissipation line on the chart represents 100% of the 12 watt max plate dissipation rating of the 6V6GT. For Class AB cathode biased amps 100% is the max safe idle or bias dissipation. For fixed bias Class AB amps we would set the bias point around 70 to 85%, the max safe idle dissipation.
If we move left from the idle bias point we find our 6V6GT will idle at 32 milliamps (green line). To determine the perfect cathode resistor value we can use: 20V bias / .032A bias current = 625 ohms. Since we have two power tubes the cathode current will be double so we cut the calculated resistance in half to 312 ohms for our ideal cathode resistor. The 5E3 actually uses a 250 ohm cathode resistor which seems would yield a very hot bias but in reality the 6V6GT is rated somewhere between 12 and 14 watts so a 250 ohm cathode resistor works just fine. Different manufacturers' 6V6 data sheets use two different max dissipation ratings which list 12 and 14 watts with 12 watts I believe being very conservative.
To find the cathode resistor power rating we take our idle bias voltage * idle current and get 20V * (2 x .032A) = 1.28 watts. To find a safe watt rating we double the calculated idle wattage: 1.28w * 2 = 2.6 watts so a 3 watt resistor would be adequate but I like that Fender went with a larger 5 watt cathode resistor for increased reliability, longevity and reduced resistor hiss.
5E3 Deluxe 6V6GT Pentode Power Tube
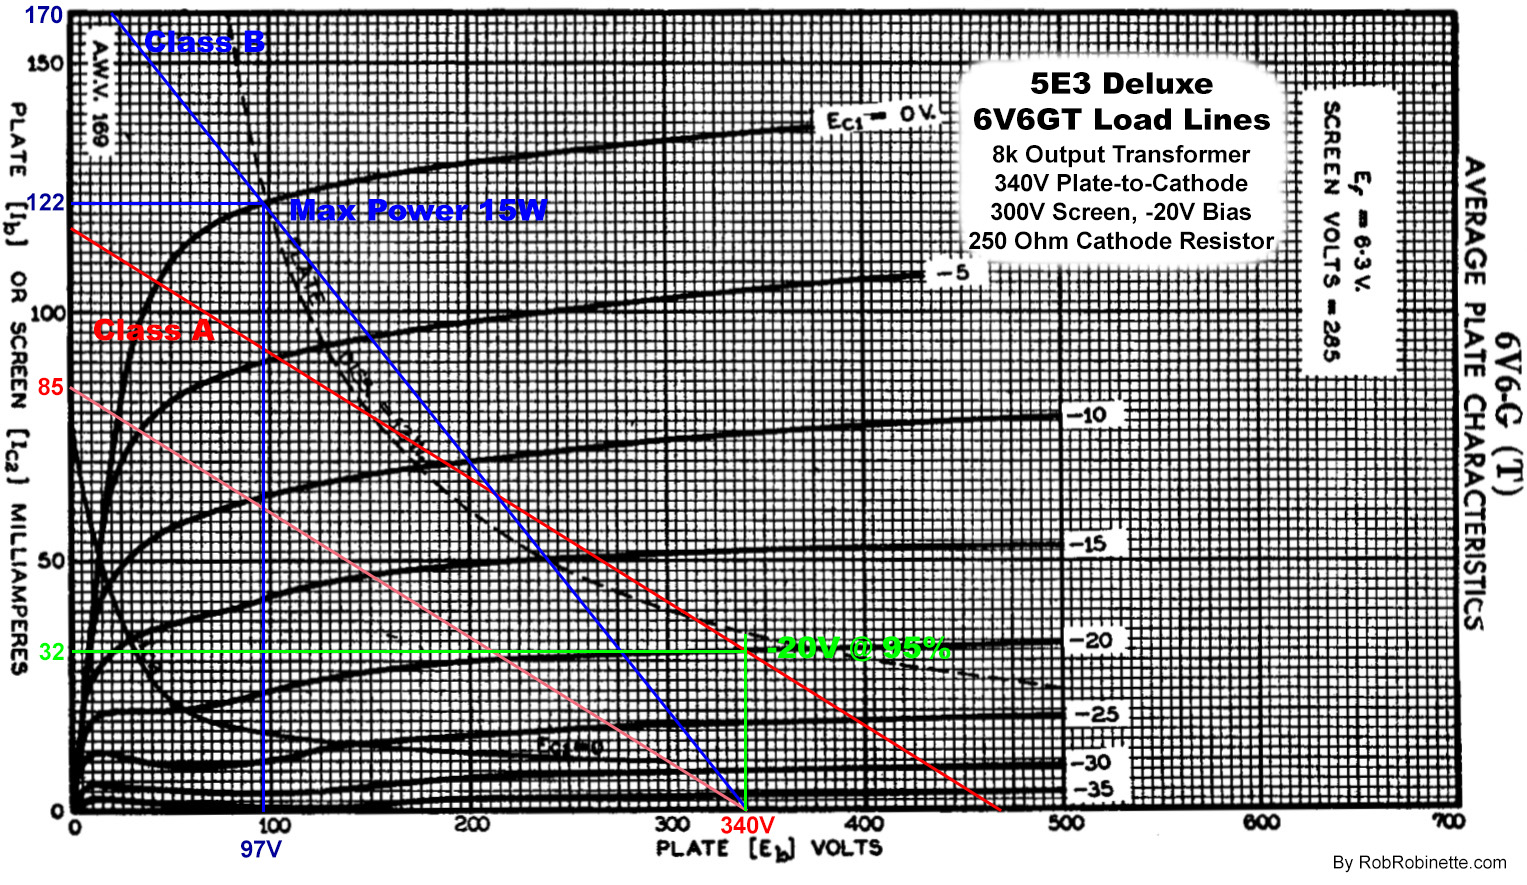
The green idle lines show the idle bias, quiescent or Q point. The tube will idle at 340 plate-to-cathode volts and 32ma. The pink line is the temporary Class A plate load line which runs from 340 volts to 85ma. We slide the line up to meet the idle bias point so the red line is the actual Class A plate load line. The blue line is the Class B plate load line which runs from 340 volts to 170ma. The point where the blue Class B line intersects the 0 grid volt curve gives us maximum output power. With a voltage swing of (340V - 97V) * 122ma / 2 = 14.8 max watts of output at the speaker.
The 5E3 uses a Class AB power amp so we have to draw two plate load lines, one for Class A operation and one for Class B operation.
During Class A operation both power tubes are conducting so each tube sees 1/2 RLoad: 8k / 2 = 4k.
We divide the plate-to-cathode voltage by the RLoad = 340V / 4000 ohms = 85ma. We draw the initial or temporary Class A load line (pink) from 340 cathode-to-plate volts at the bottom of the chart to 85ma on the left. This gives the correct line slope but we have to slide the line up, keeping the slope the same, to intersect the load line with our idle point (green). This is our actual Class A load line (red).
During Class B operation only one power tube is conducting so half of the output transformer windings "disappear". Since the impedance ratio is the square of the turns ratio the operating tube sees only ¼ of the transformer's plate-to-plate impedance so we'll use an RLoad of 8k / 4 = 2k for Class B operation. 340 / 2000 = 170ma. We draw the Class B load line (blue) from 340 volts to 170ma. Since 170ma is off the chart we have to estimate where the line intersects 170 on the left side of the chart.
To calculate our approximate maximum output power we find where the Class B load line crosses the 0V grid curve. We use the Class B load line because at maximum power the amp will be in Class B operation. At the intersection of the Class B load line and the 0V curve we get 122ma of peak current and a 97 volt minimum swing. The total rms output power is then approximately:
Max Class B Power = voltage swing * peak current / 2
Max Class B Power = (cathode-to-plate voltage - minimum voltage) * peak current / 2
Max Class B Power = (340V - 97V) * .122A / 2 = 14.8 watts at the speaker--this tells us the watt rating of our output transformer and speaker
We can calculate maximum power in Class A mode by looking at the intersection of the Class A and Class B load lines. At the intersection we have 215v and 64ma so the voltage swing is 468v - 215v = 253v. So 253v * .064a = 16.2w / 2 = 8.1 watts of Class A power. If you run the amp below 8.1 watts the amp will stay in Class A mode.
The finished chart shows that a 5E3 Deluxe plugged into modern wall power of around 125v is biased on the warm side. It is permissible for the load lines to creep inside the maximum plate dissipation curve and again the real rating of 6V6 tubes is somewhere between 12 and 14 watts. If 5E3 amps were burning up their power tubes at an excessive rate we could bump up the cathode resistor to 270 to 330 ohms to cool the bias or use Zener diodes to drop some B+ voltage but that doesn't seem to be a problem so I recommend keeping the 5E3 circuit as designed.
EF80 Small Pentode Power Power Amp Design
I wanted to design a low power EF80 small pentode push-pull power amp for use in my micro amp designs so I tracked down the EF80 datasheet, copied the characteristics chart and went to work.
Since most guitar amps push their power tubes at or beyond the max plate voltage I referenced the EF80 datasheet and found that 300 volts was the max plate or "anode" voltage (Va or anode volts) so I decided to use 300 idle plate volts. If I were designing a stereo audio amp I would be more conservative and choose 250 volts for my idle plate voltage.
To get an idea of what type of output transformer load this little tube needs I drew an initial plate load line from 300v (my planned plate voltage) to 26ma on the left scale. I chose 26ma because it gave me a load line slope that looked "about right".
We then divide the plate voltage by the plate current to get the proper plate load: 300v / .028a = 10,714. For a push-pull amp we need to double 10,714 to get the desired plate-to-plate impedance of 21,428. The Hammond 125B output transformer can be wired for 22,500 plate-to-plate impedance (22.5K:8 ohms) so that is what I will use in this power amp design.
Initial Plate Load Line on the Plate Characteristics Chart
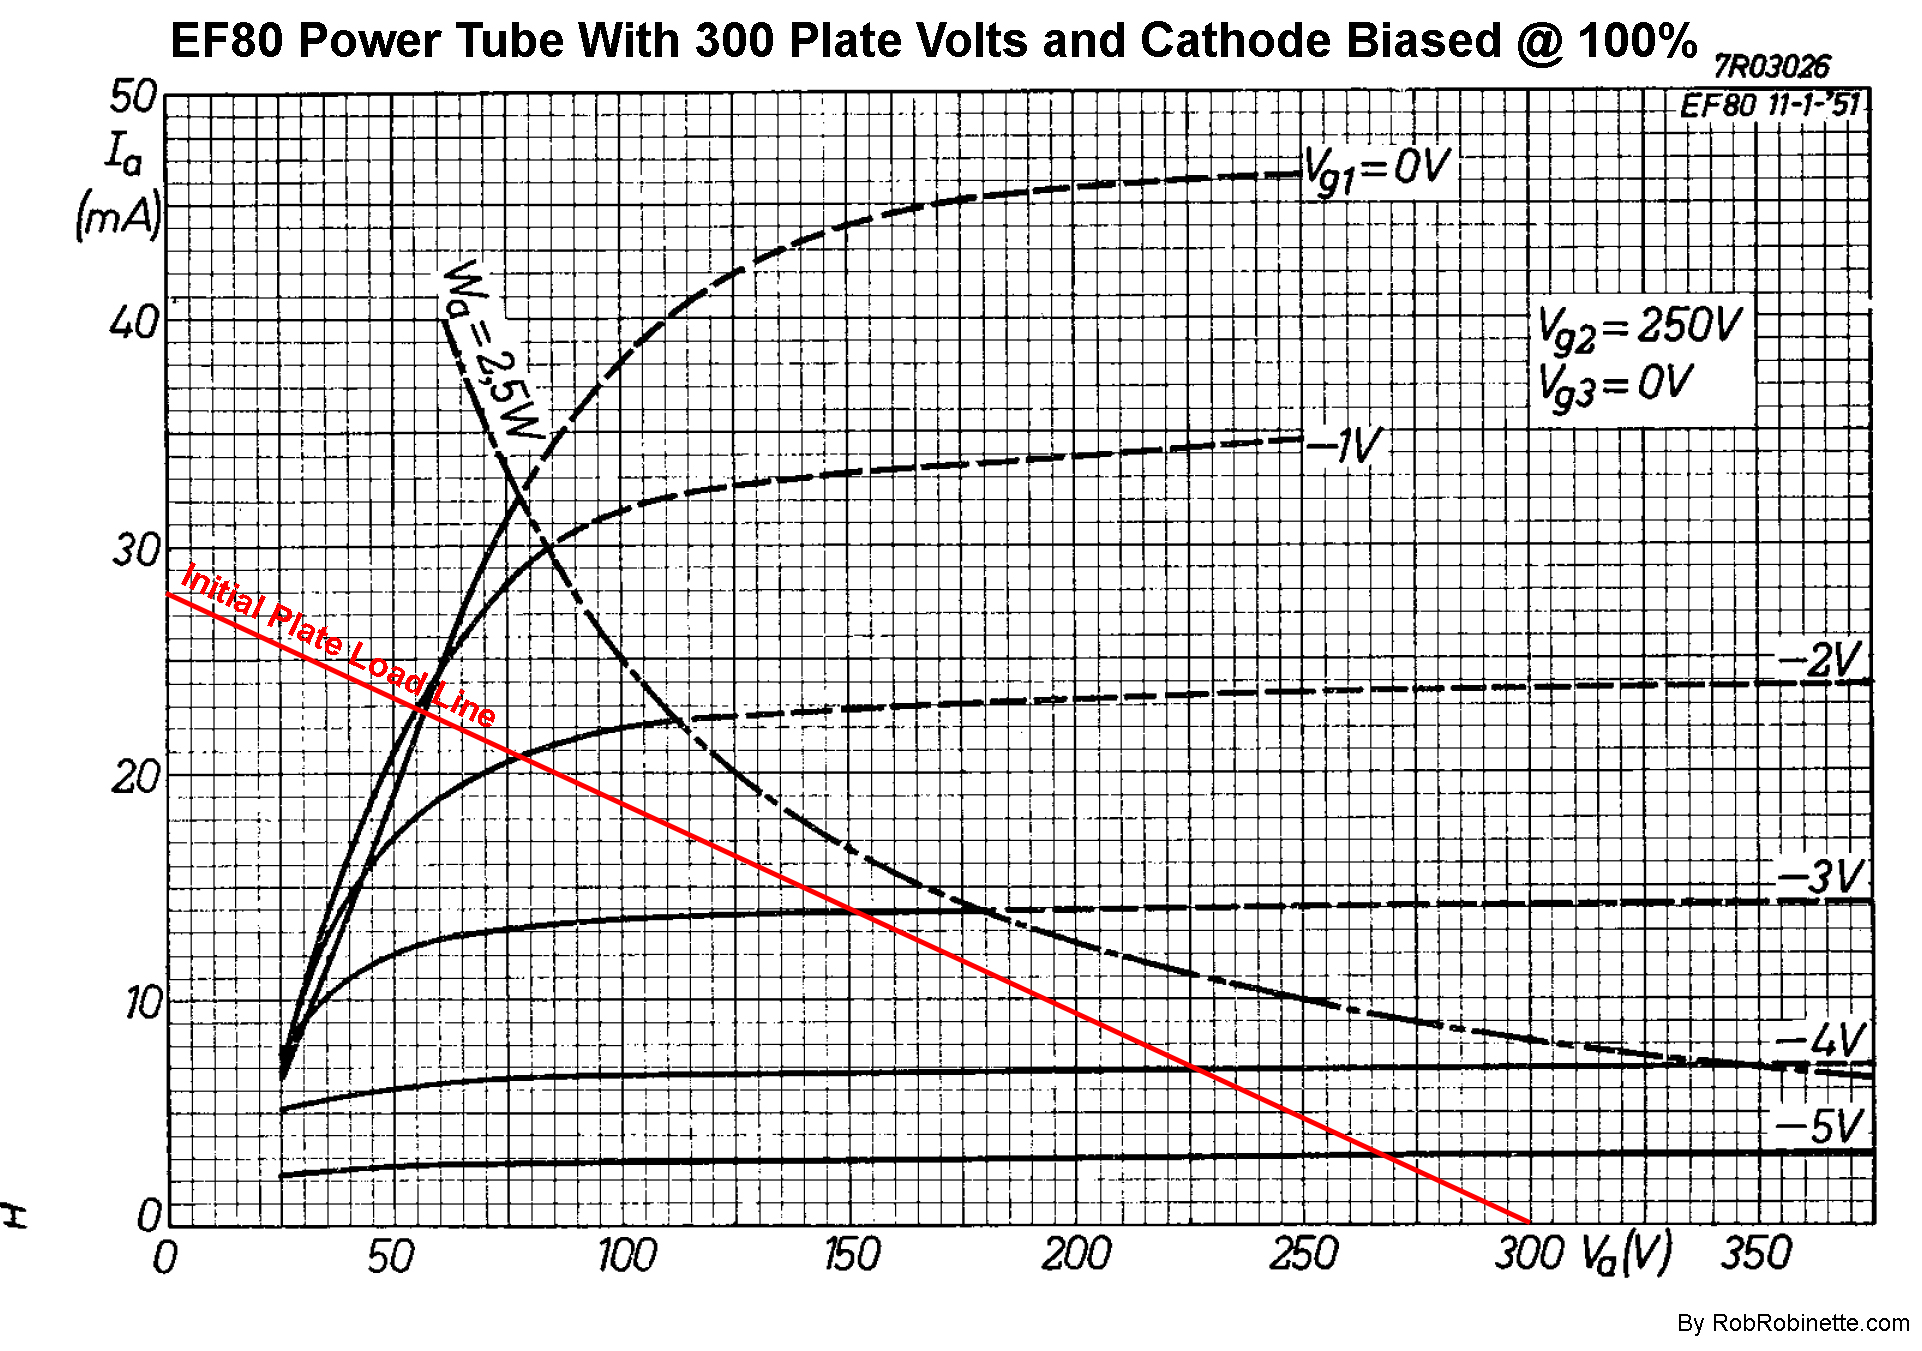
The characteristics chart shows plate (anode) voltage (Va) along the bottom, plate current (Ia) in milliamps along the left, grid voltage (Vg1) curves and max plate dissipation (Wa) curve inside the chart. To find what plate load is needed for the EF80 pentode I drew an "initial plate load line" from my planned plate voltage (300v) to 28ma of plate current which gives a "proper looking" load line slope. We divide 300v by .028a and get 10,714 ohms of plate load for a single ended amp. We double that and get 21,428 ohms plate-to-plate for a push-pull amp.
People often ask me, "Can I use an output transformer with x ohms for this amp?" The power tube characteristics chart will give us the answer. Let's say you have a spare 5E3 Deluxe output transformer with 8K:8 ohms (8k ohms plate-to-plate impedance with an 8 ohm secondary) and want to see if you can use it for an EF80 push-pull power amp. We divide our planned plate voltage of 300v by 4000 ohms (half the plate-to-plate impedance) and get 75 milliamps. We then plot a line on the characteristics chart from 300v to 75ma and we see that 75ma is off the chart and we'd have a very steep plate load line and as we will see below, the Class B load line would be steeper still. So the answer to our question is no, we cannot use a 5E3 output transformer in an EF80 push-pull power amp.
We can now erase the "initial plate load line" and draw the bias line. The Max Dissipation Curve (Wa or anode watts) on the chart represents 100% of the 2.5 watt max plate dissipation rating of the EF80. For Class AB cathode biased amps 100% is the max safe idle or bias dissipation and a good place to start.
We draw our bias line (green) vertically up from our plate voltage of 300 to the max dissipation curve (100% bias is wanted for this cathode biased power amp). From the intersection of 300v and 100% dissipation I drew the horizontal portion of the bias line left to 8.2 milliamps. This gave me an idle (Q) point of 300v, 8.2ma of idle or bias plate current, 2.5 watts and 3.85v grid bias (from grid voltage curves). For a push-pull amp we would double the current to 16.4ma of idle bias current.
To determine the perfect cathode resistor value we can use: 3.85v bias / .0082a bias current = 470 ohms. Since we have two power tubes the cathode current will be double so we cut the calculated resistance in half to 235 ohms for our ideal cathode resistor. The closest standard resistor value is 240 ohms for our cathode resistor.
To find the cathode resistor power rating we take our idle bias voltage * idle current: 3.85v * .0082a = 0.03 watt. To find a safe watt rating we double the calculated idle wattage: 0.03w * 2 = 0.06 watts so a 1/4 watt resistor would be adequate but I will use a 1 watt resistor for less shot noise and increased reliability and longevity.
EF80 Pentode Push-Pull Power Tube
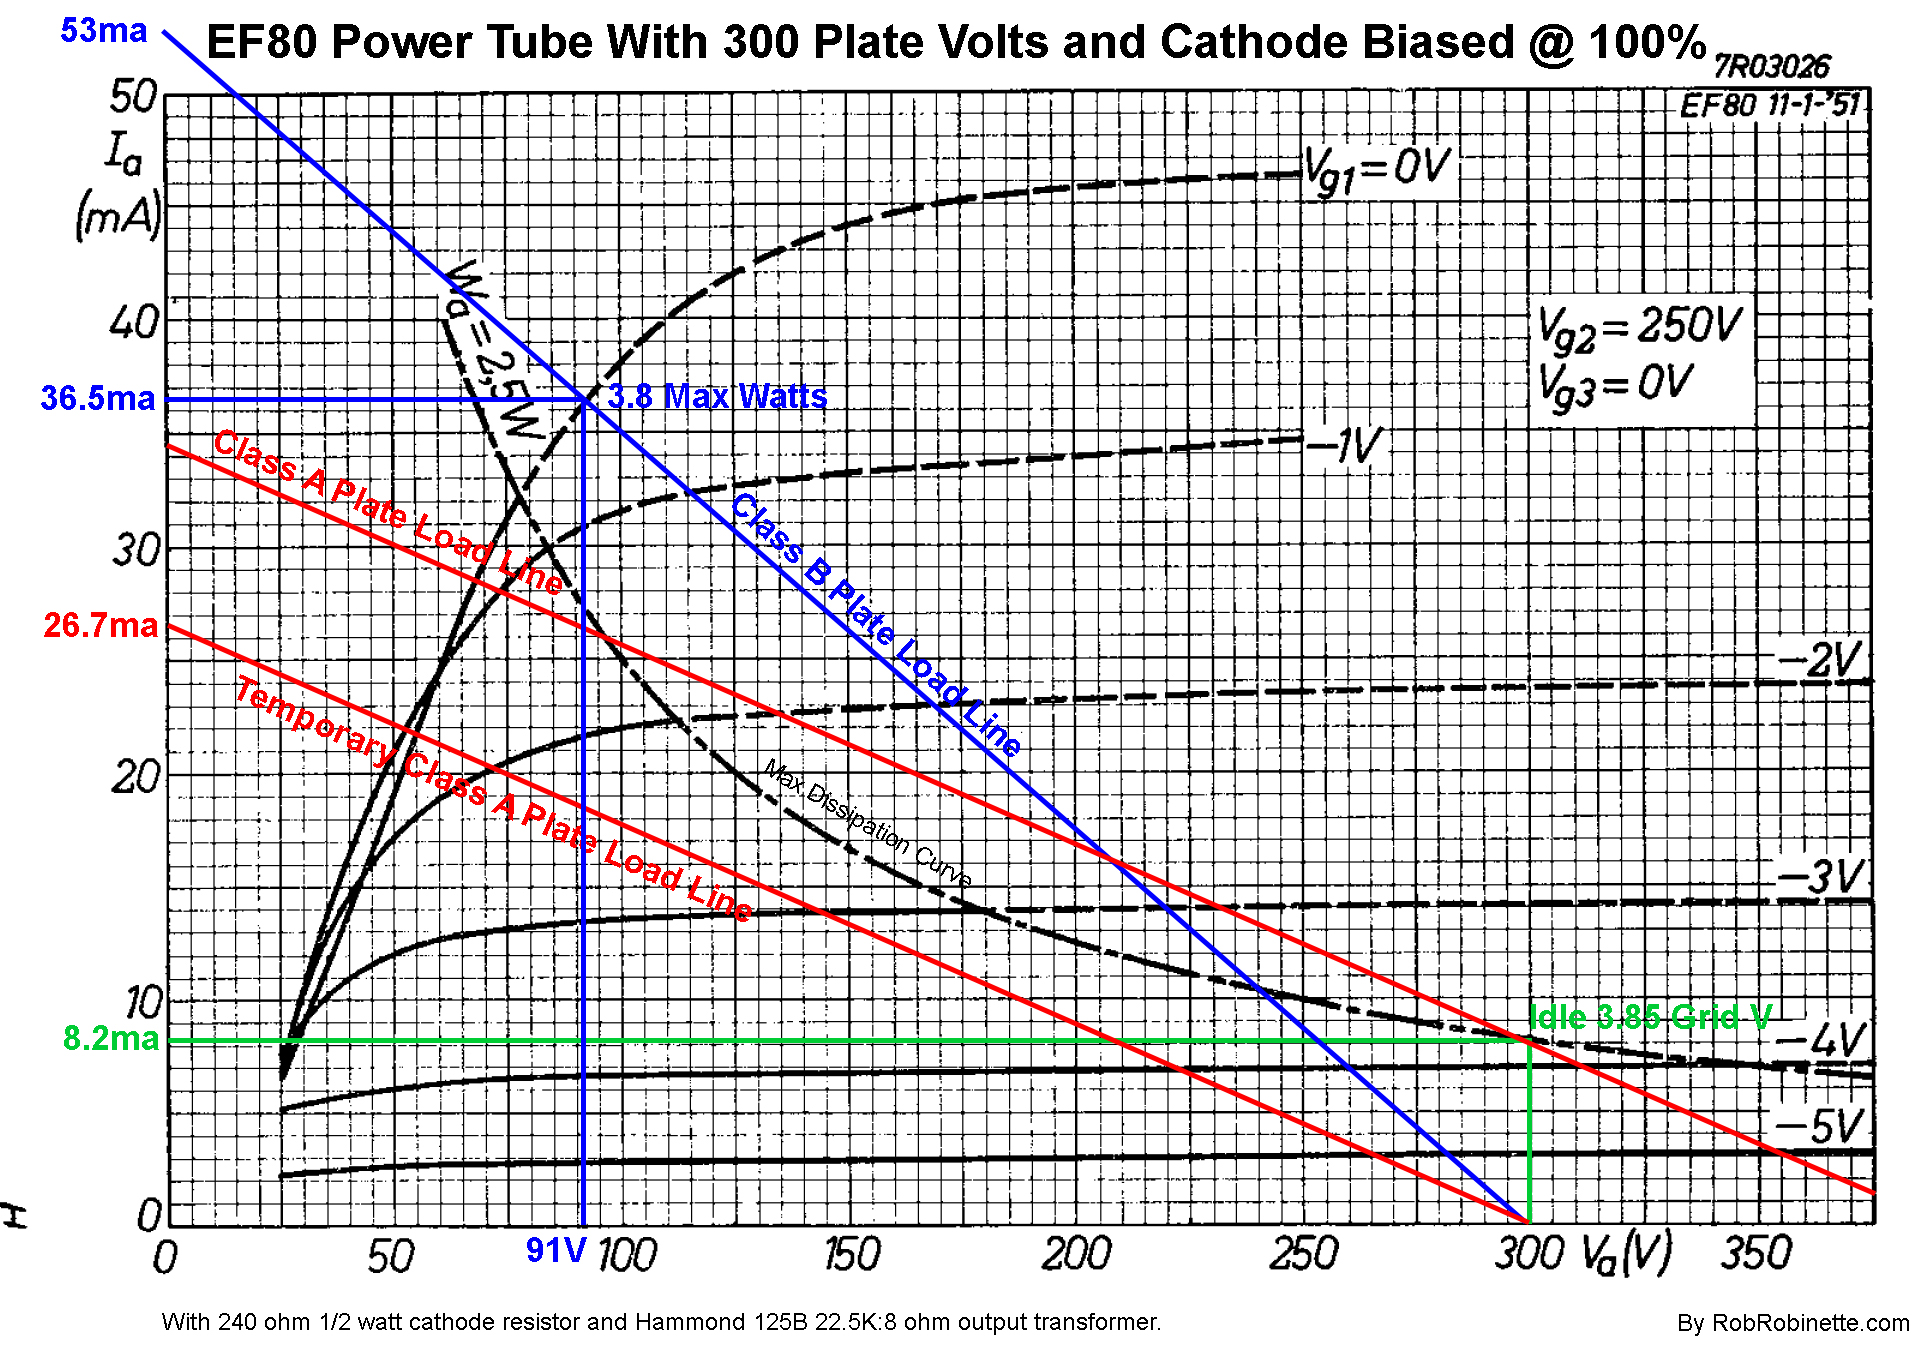
The green idle lines show the idle bias, quiescent or Q point. The tube will idle at 300 plate volts, 8.2ma of plate current, 3.85 grid volts, 2.5 watts and 100% of max plate dissipation. The lower red line is the temporary Class A plate load line which runs from 300 volts to 26.7ma. We slide the line up to meet the idle bias point so the upper red line is the actual Class A plate load line. The blue line is the Class B plate load line which runs from 300 volts to 53ma. The point where the blue Class B line intersects the 0 grid volt curve gives us maximum output power. With a voltage swing of (300V - 91V) * .0365a / 2 = 3.8 max watts at the speaker.
Our EF80 power amp uses Class AB power so we have to draw two plate load lines, one for Class A operation and one for Class B operation.
Since I wanted to use a Hammond 125B output transformer (5 watts and 22,500:8Ω) I used 22,500 ohms as the plate-to-plate Rload.
During Class A operation both power tubes are conducting so each tube sees 1/2 RLoad: 22,500Ω / 2 = 11,250Ω.
We divide the plate voltage by the RLoad: 300V / 11,250 ohms = 26.7ma. We draw the temporary Class A load line (lower red line) from 300 plate volts at the bottom of the chart to 26.7ma on the left. This gives the correct line slope but we have to slide the line up, keeping the slope the same, to intersect the load line with our idle point (green). This is our actual Class A load line (upper red line).
During Class B operation only one power tube is conducting so half of the output transformer windings "disappear". Since the impedance ratio is the square of the turns ratio the operating tube sees only ¼ of the transformer's plate-to-plate impedance so we'll use an RLoad of 22,500Ω / 4 = 5625Ω for Class B operation. 300 / 5625 = 53ma. We draw the Class B load line (blue) from 300 volts to 53ma. Since 53ma is off the chart we have to estimate where the line intersects 53 on the left side of the chart.
To calculate our approximate maximum output power we find where the Class B load line crosses the 0V grid curve. We use the Class B load line because at maximum power the amp will be in Class B operation. At the intersection of the Class B load line and the 0V curve we get 36.5ma of peak current and a 91 volt minimum swing. The total rms output power is then approximately:
Max Class B Power = voltage swing * peak current / 2
Max Class B Power = (plate voltage - minimum voltage) * peak current / 2
Max Class B Power = (300V - 91V) * .0365A / 2 = 3.8 watts at the speaker--this tells us our output transformer and speaker must handle at least 3.8 watts
We can calculate maximum power in Class A mode by looking at the intersection of the Class A and Class B load lines. At the intersection we have 207v and 16.2ma so the Class A voltage swing is 300v - 207v = 93v. So 93v * .0162A = 1.5w / 2 = 0.75 watts of Class A power. If you run the amp below 0.75 watts the amp will stay in Class A mode.
It is permissible for the plate load lines to creep inside the maximum plate dissipation curve but the chart shows our little power amp will be stressed at max power. If you find your power tubes are not lasting as long as you would like then consider bumping up the cathode resistor to 270 or 300 ohms to cool the bias.
EF80 Push-Pull Power Amp
Since I am pushing the EF80 to its 300 plate volt limit I decided to increase the cathode resistor from 240 to 300 ohms to cool the bias in the name of tube longevity.
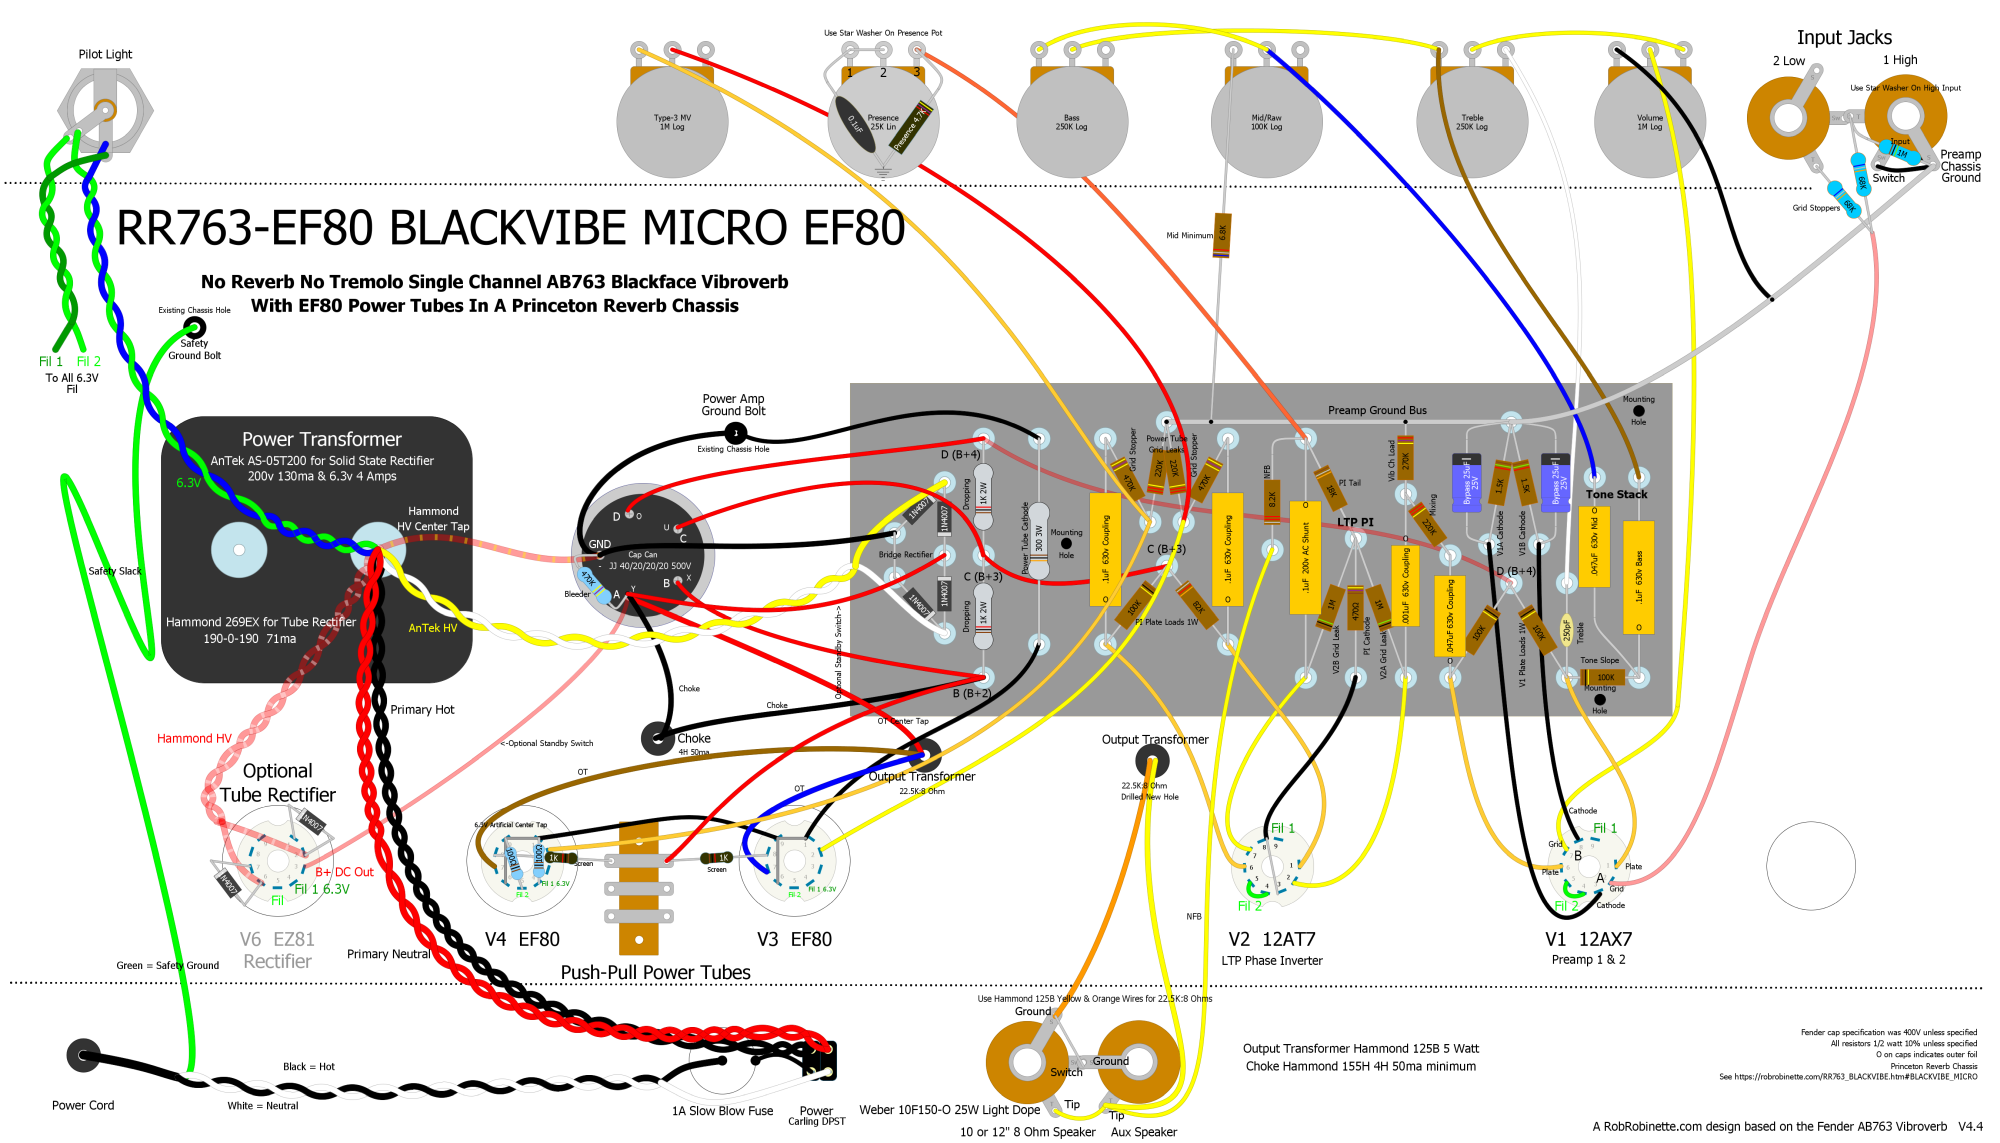
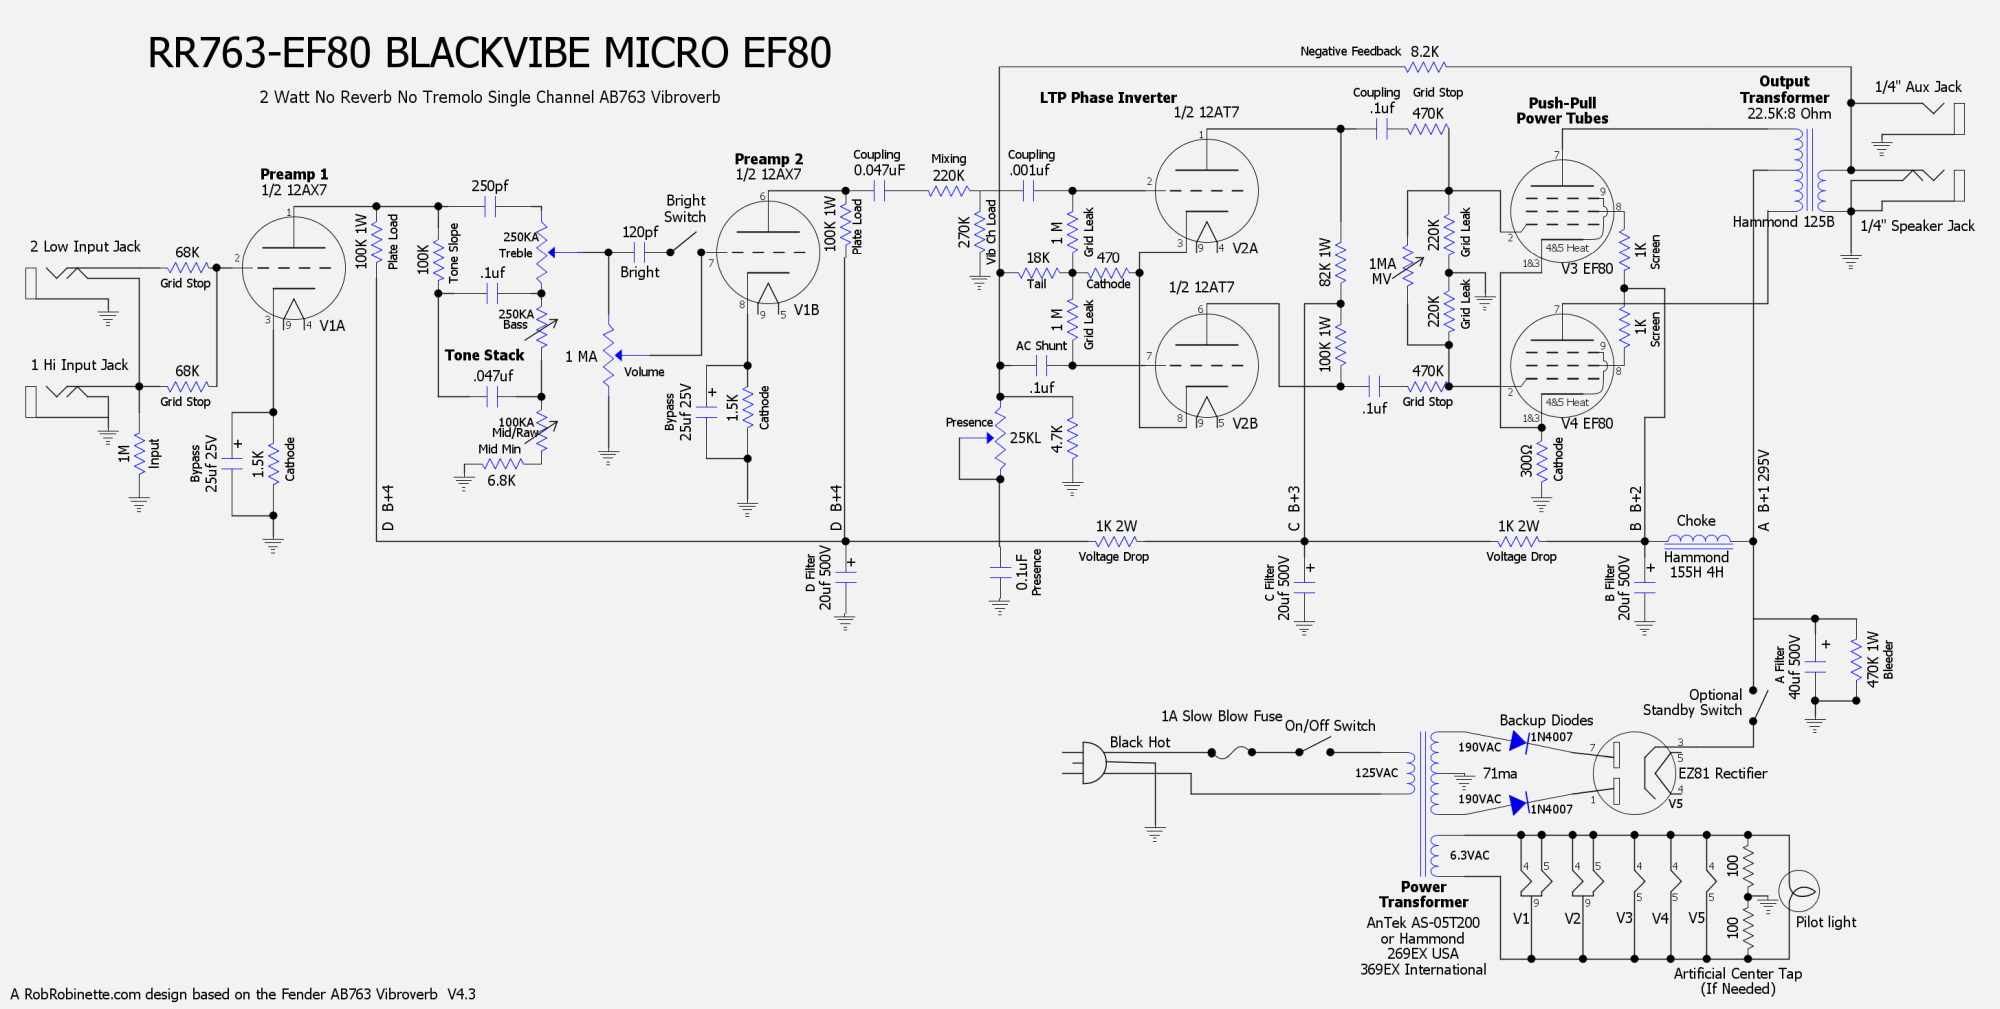
AB763 single channel blackface Vibroverb EF80 micro with reverb and tremolo deleted. More info on the amp here.
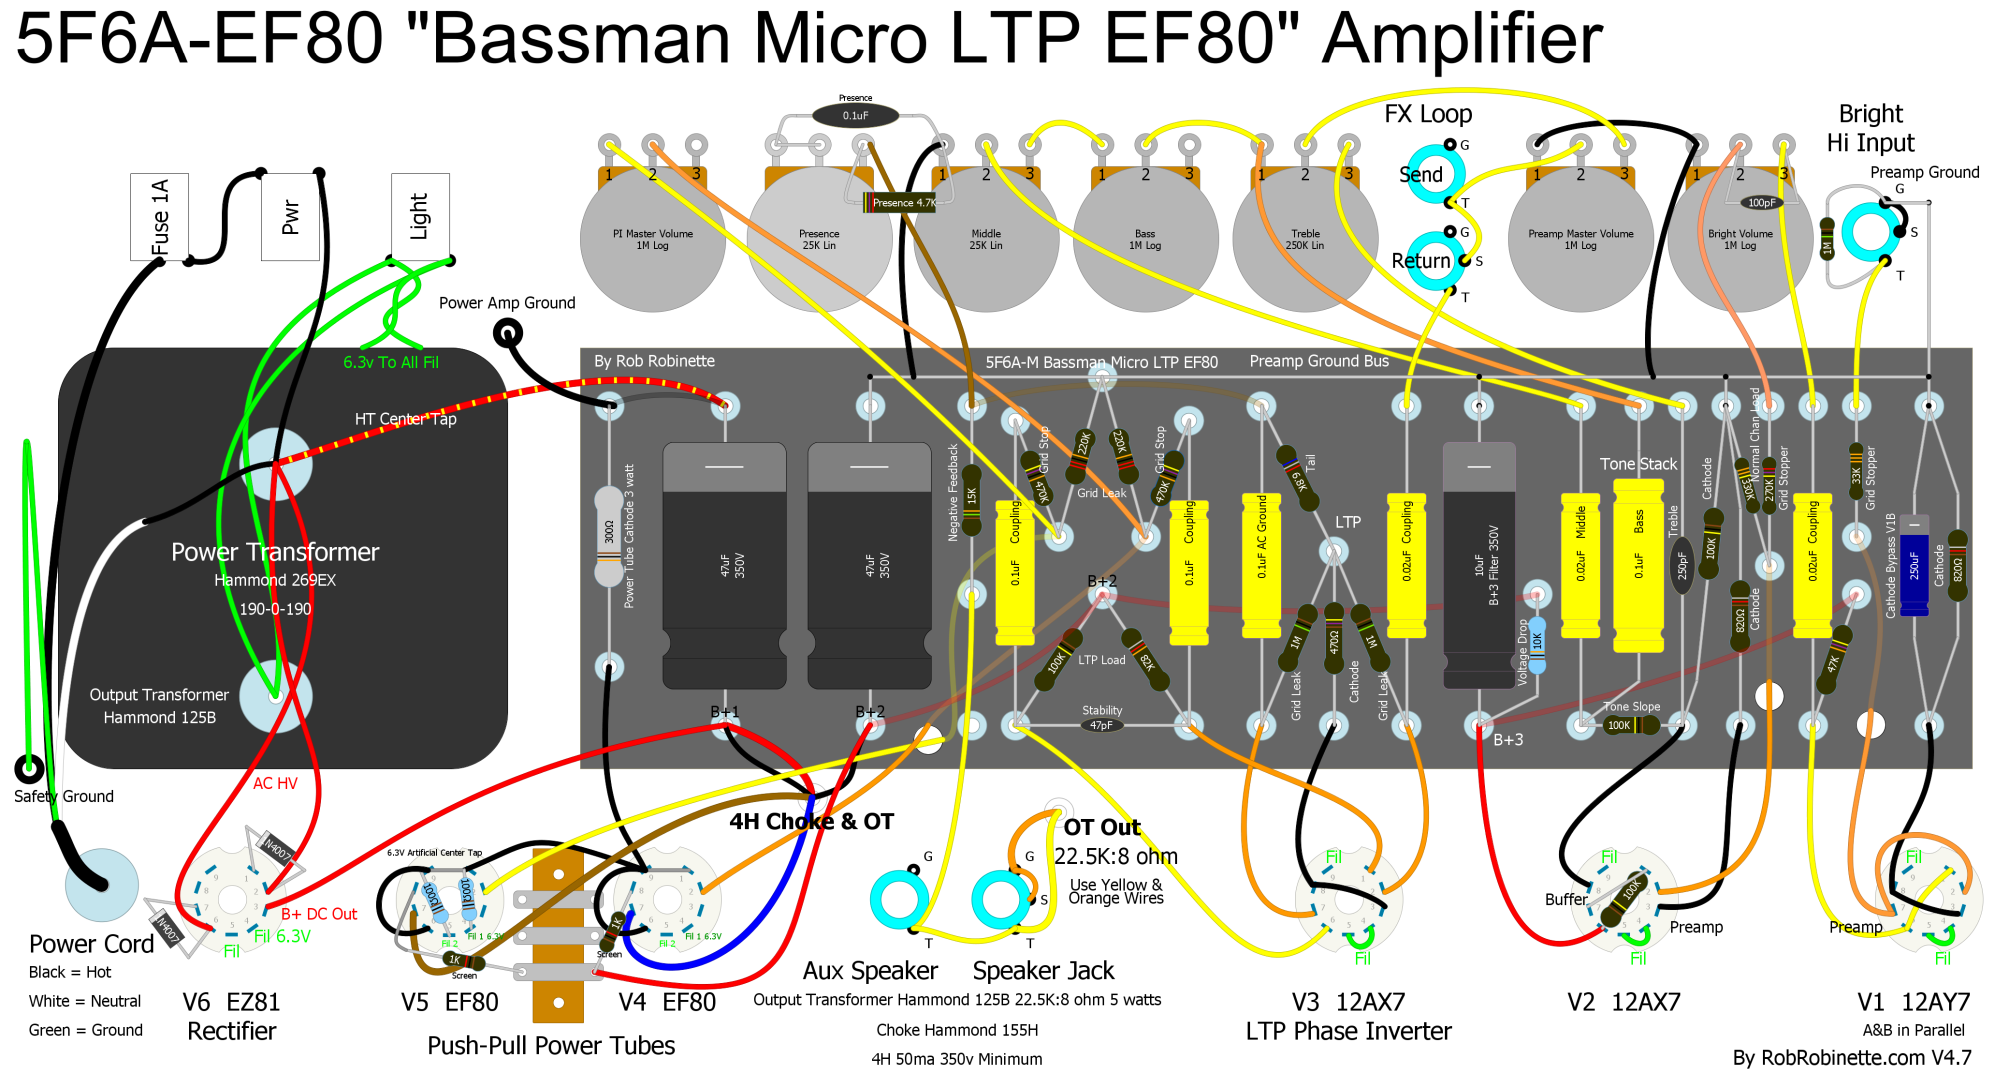
See the Bassman Micro LTP EF80 page for more info.
Soldano SLO-100 Based 1 Watt Amp With EF80 Power Amp.
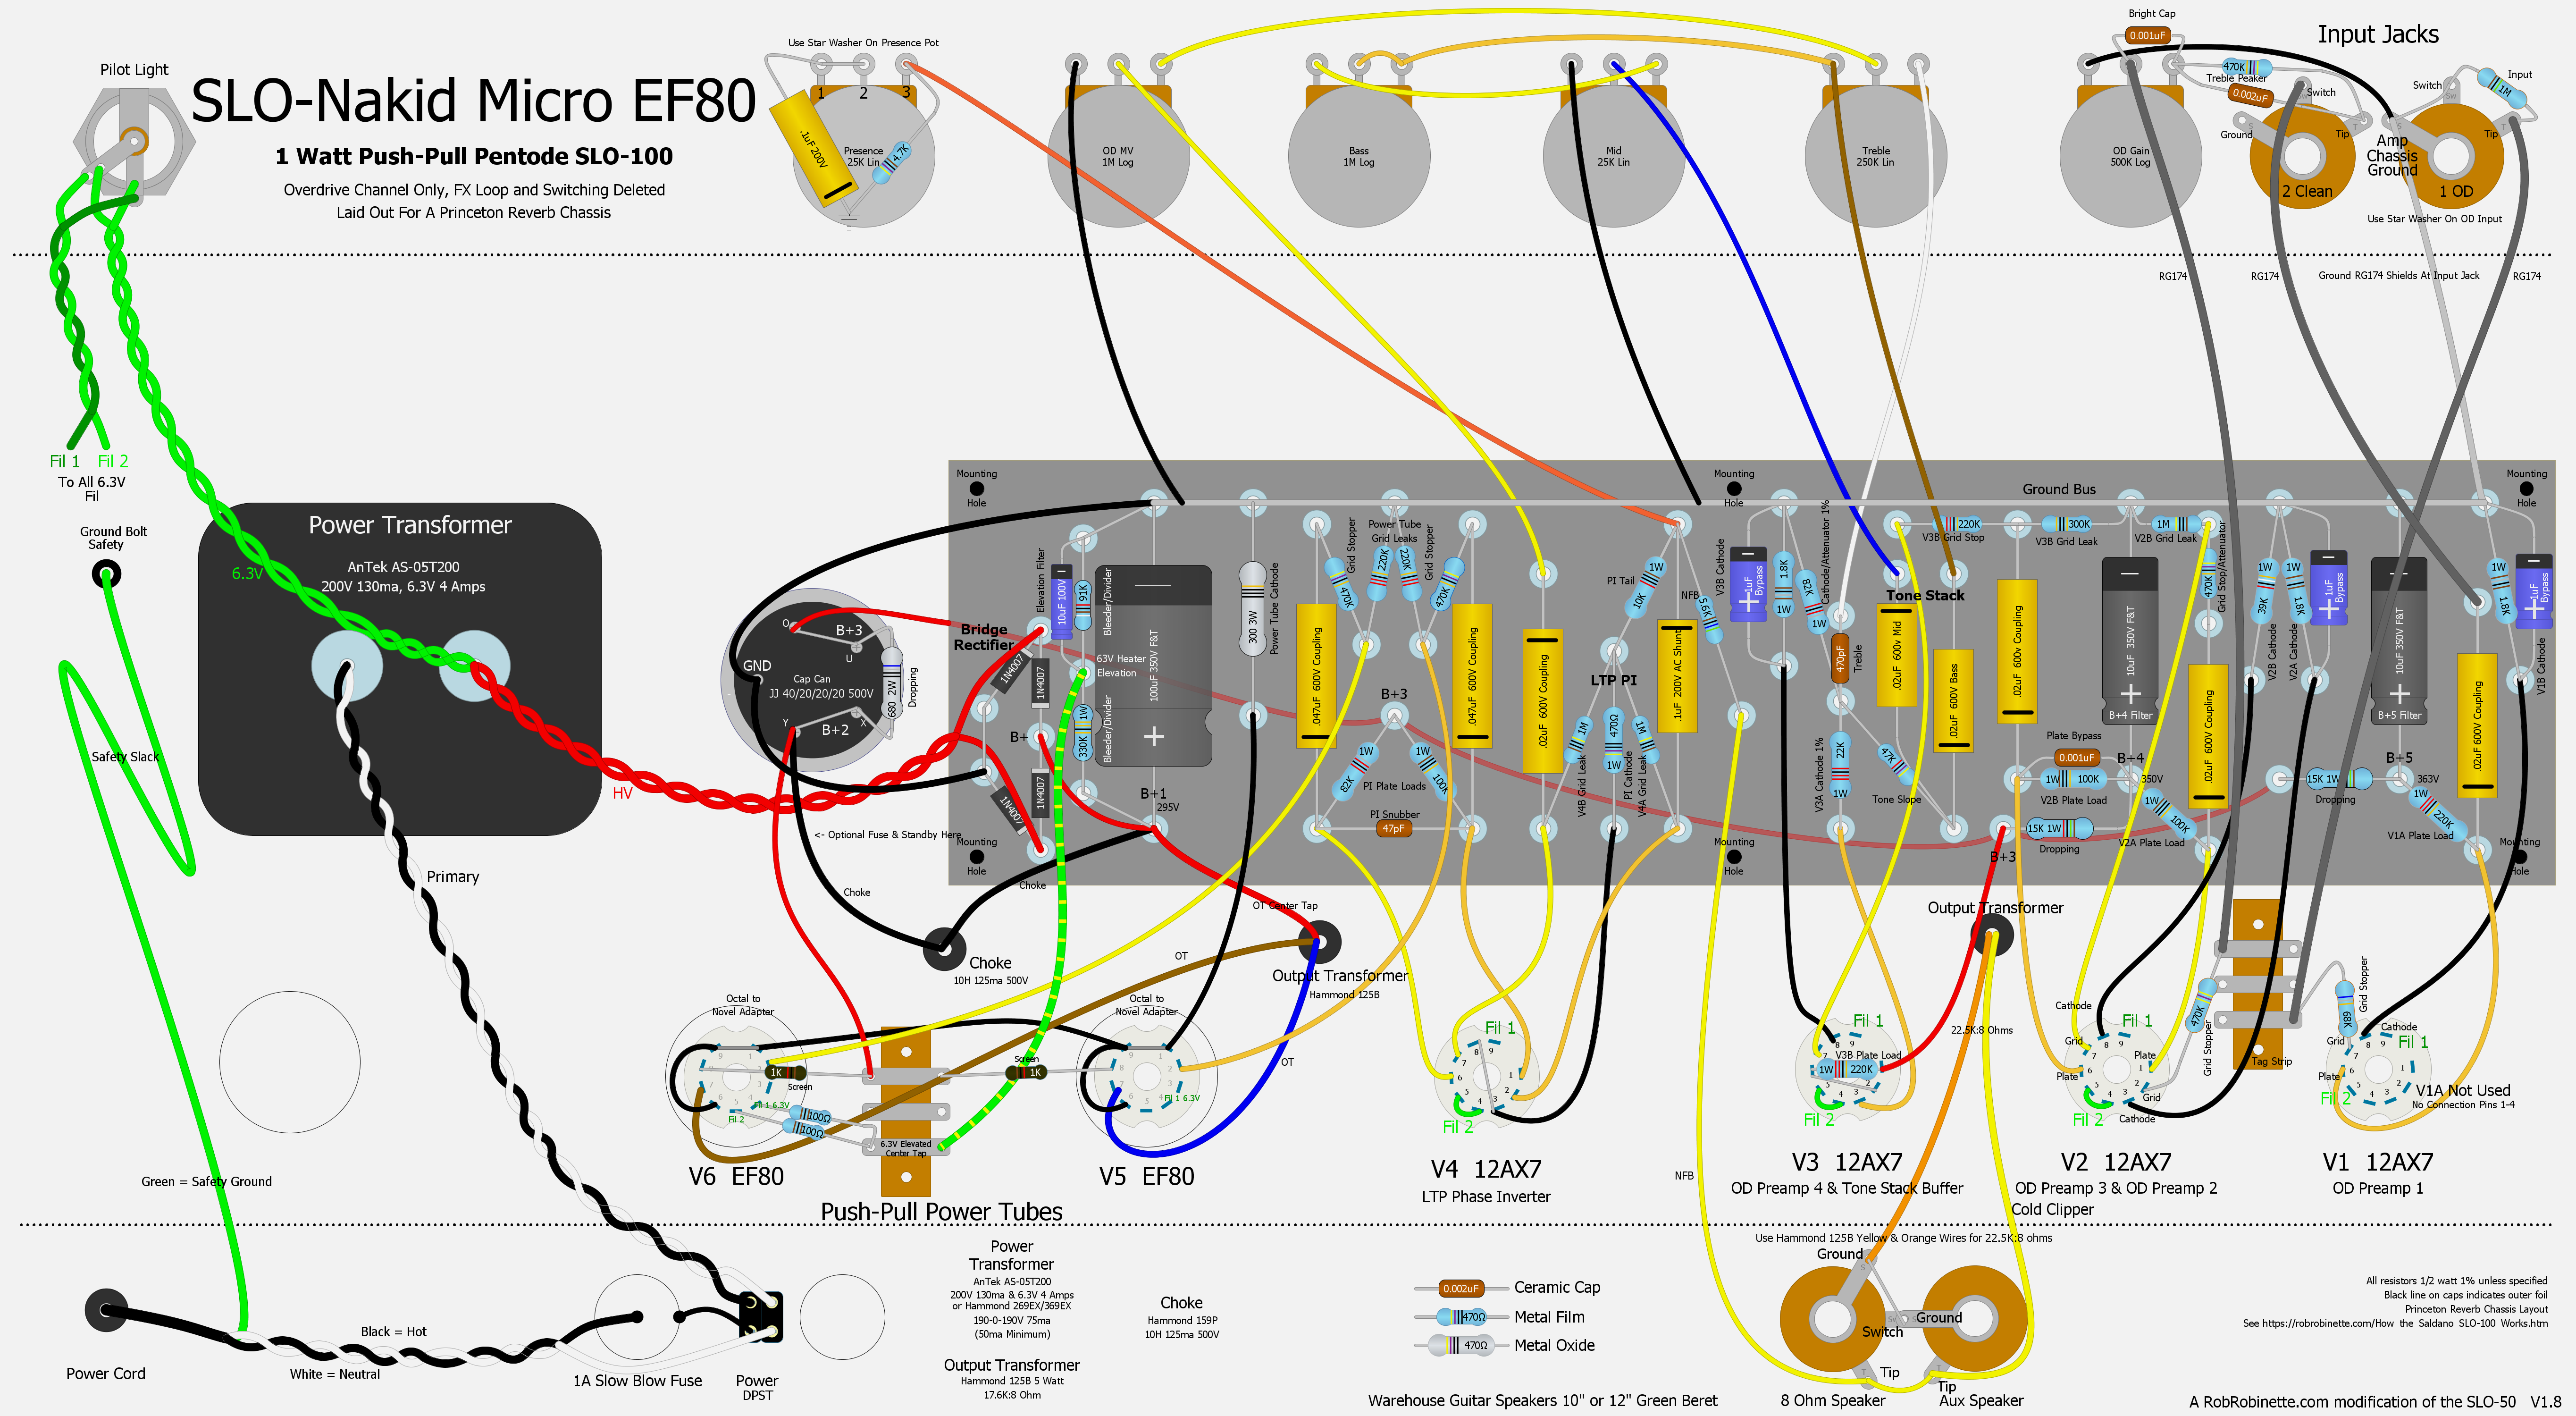
This is a 1 Watt push-pull pentode SLO-100, Overdrive Channel only with FX Loop and Switching deleted and laid out for a Princeton Reverb chassis. More info on the amp here.
Small Single-Ended Pentode Champ Micro
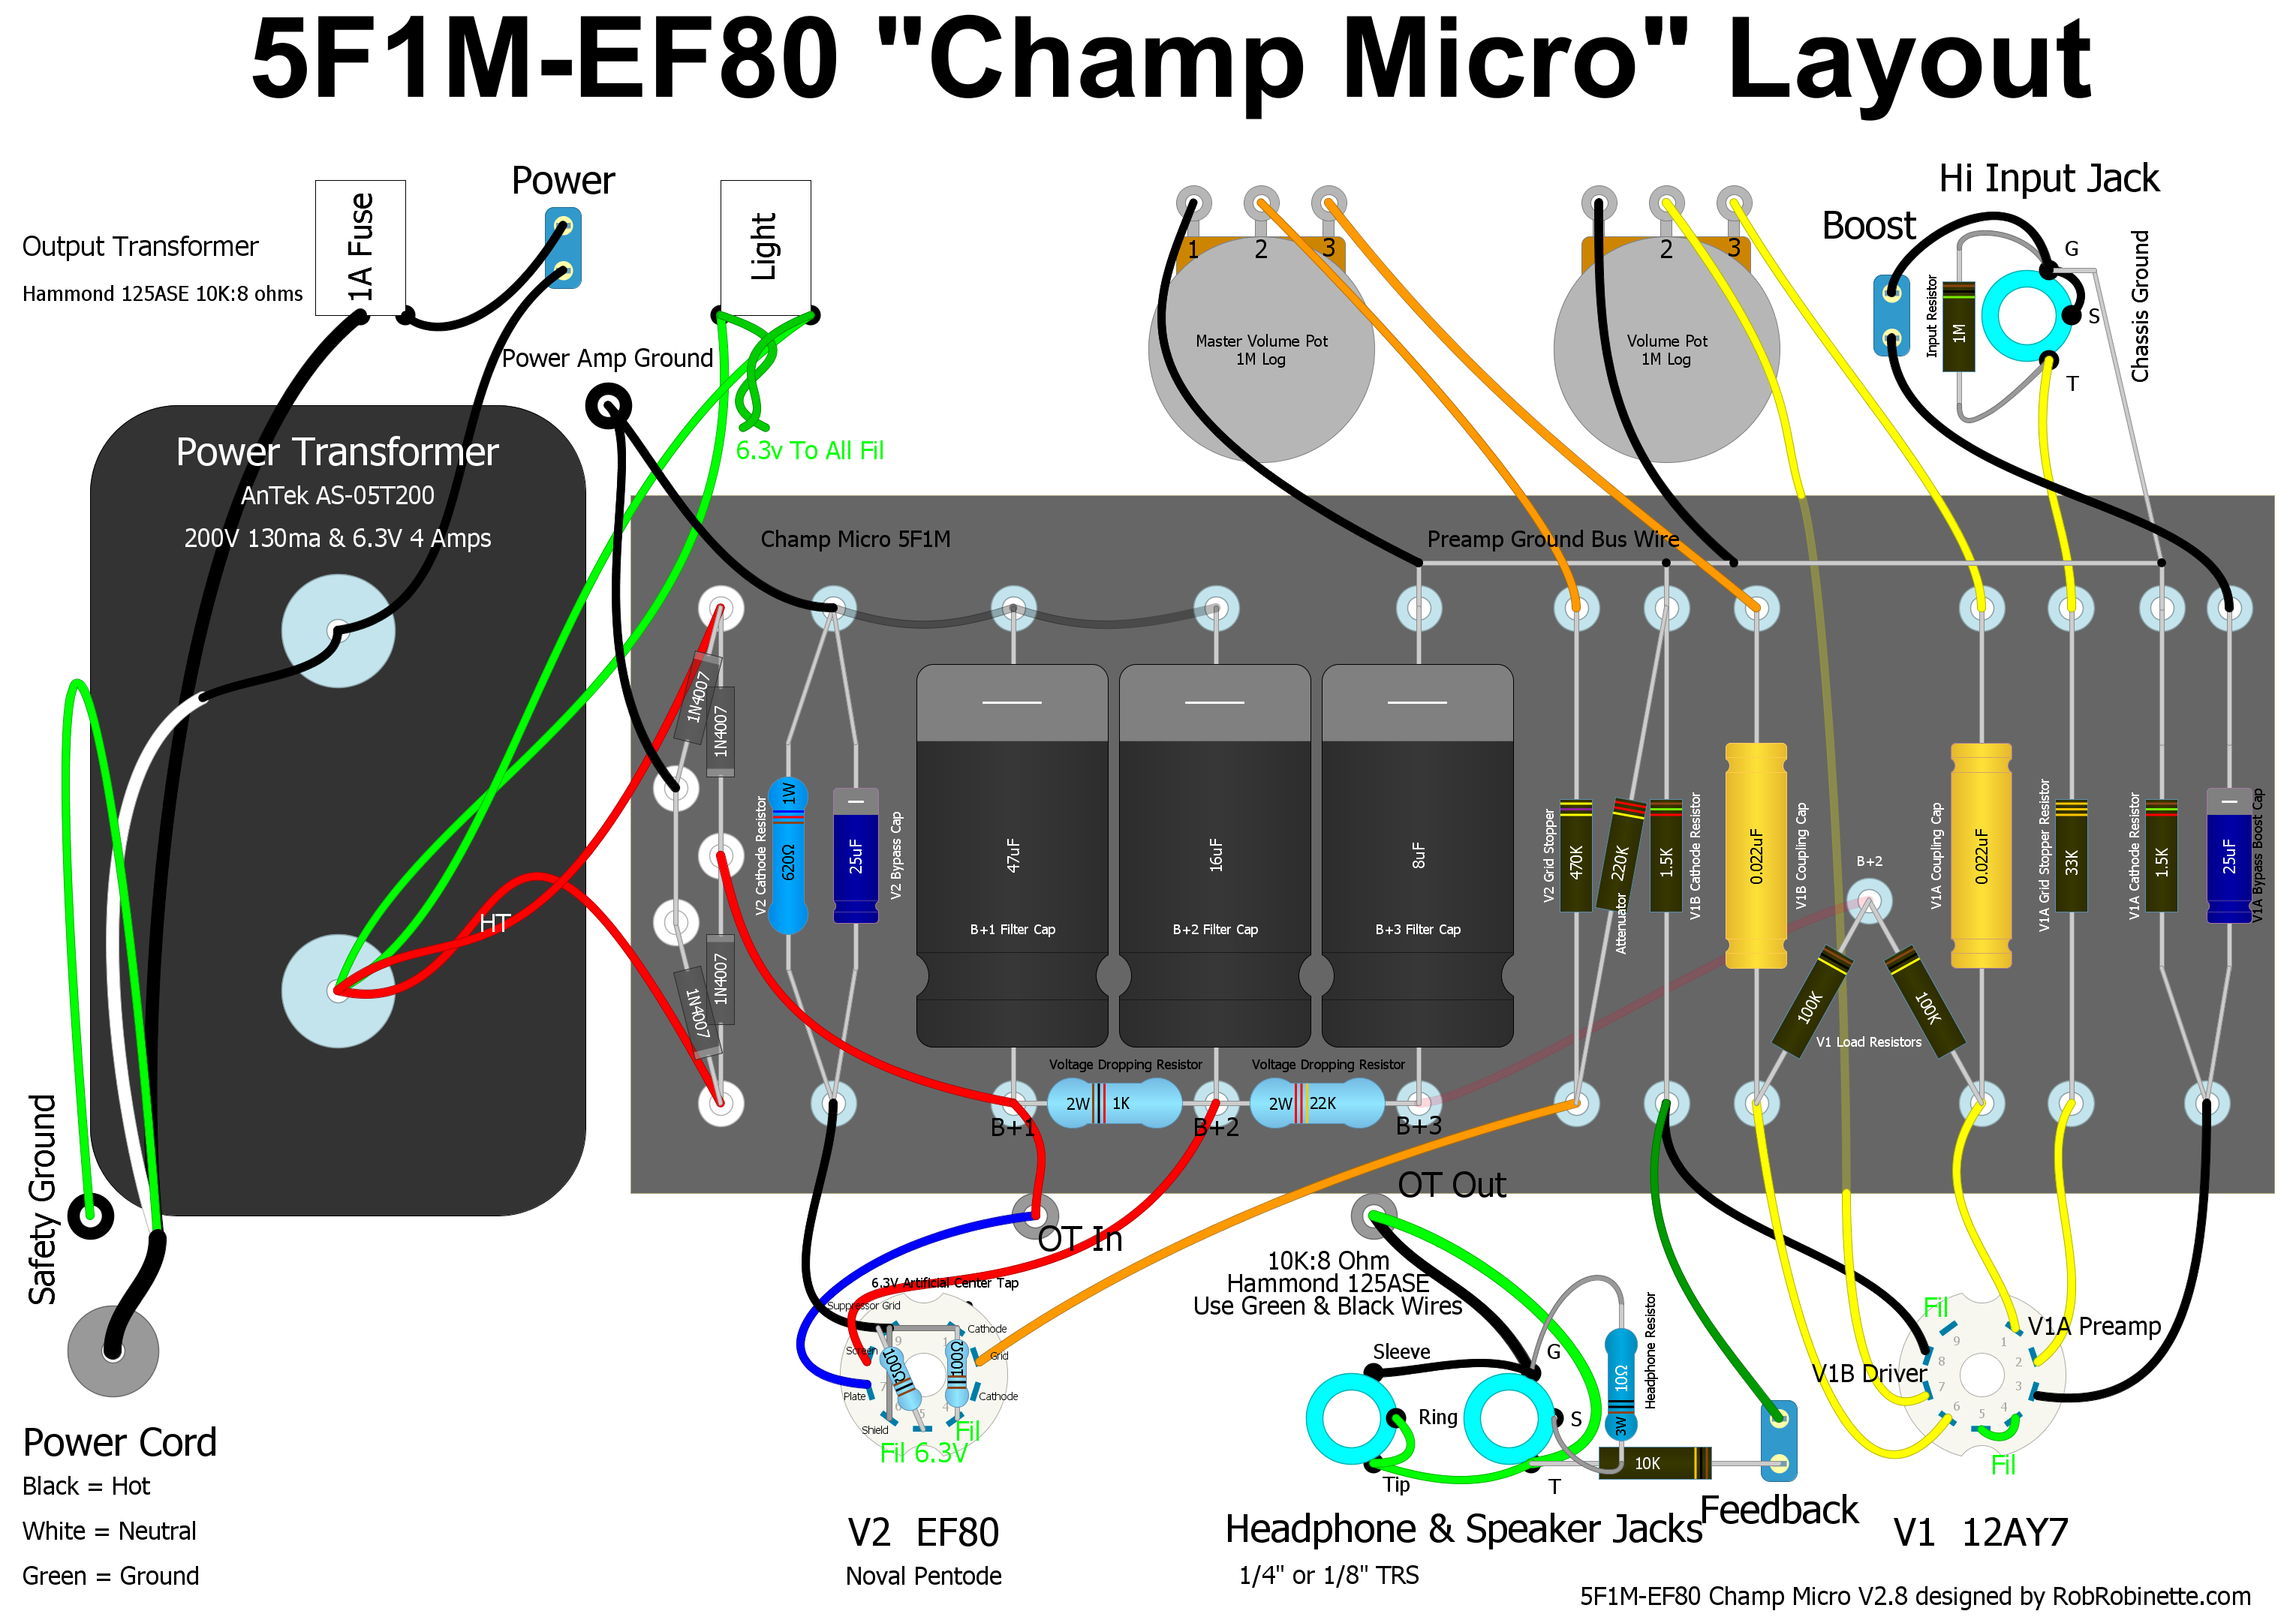
The Champ Micro EF80 uses an AnTek AS-05T200 toroidal or Hammond 269EX power transformer and 125ASE output transformer (wired for 10K:8 ohms). The cathode resistor has been changed to a 620 ohm 1 watt to better suit the EF80 power tube. The EF80 pinout is: 1. Cathode 2. Control Grid g1 3. Cathode (same as 1) 4. Heater 5. Heater 6. No Connection 7. Plate or Anode 8. Screen Grid g2 9. Suppressor Grid g3. It uses the same circuit board and Hoffman board file as the Champ Micro. Click the image to see the hi-res version. Download the pdf.
By Rob Robinette
References
RCA Corporation, RCA Receiving Tube Manual, RC30.
Merlin Blencowe, Designing Tube Preamps for Guitar and Bass, 2nd Edition.
Merlin Blencowe, Designing High-Fidelity Tube Preamps
Morgan Jones, Valve Amplifiers, 4th Edition.
Richard Kuehnel, Circuit Analysis of a Legendary Tube Amplifier: The Fender Bassman 5F6-A, 3rd Edition.
Richard Kuehnel, Vacuum Tube Circuit Design: Guitar Amplifier Preamps, 2nd Edition.
Richard Kuehnel, Vacuum Tube Circuit Design: Guitar Amplifier Power Amps
Robert C. Megantz, Design and Construction of Tube Guitar Amplifiers
Neumann & Irving, Guitar Amplifier Overdrive, A Visual Tour It's fairly technical but it's the only book written specifically about guitar amplifier overdrive. It includes many graphs to help make the material easier to understand.
T.E. Rutt, Vacuum Tube Triode Nonlinearity as Part of The Electric Guitar Sound